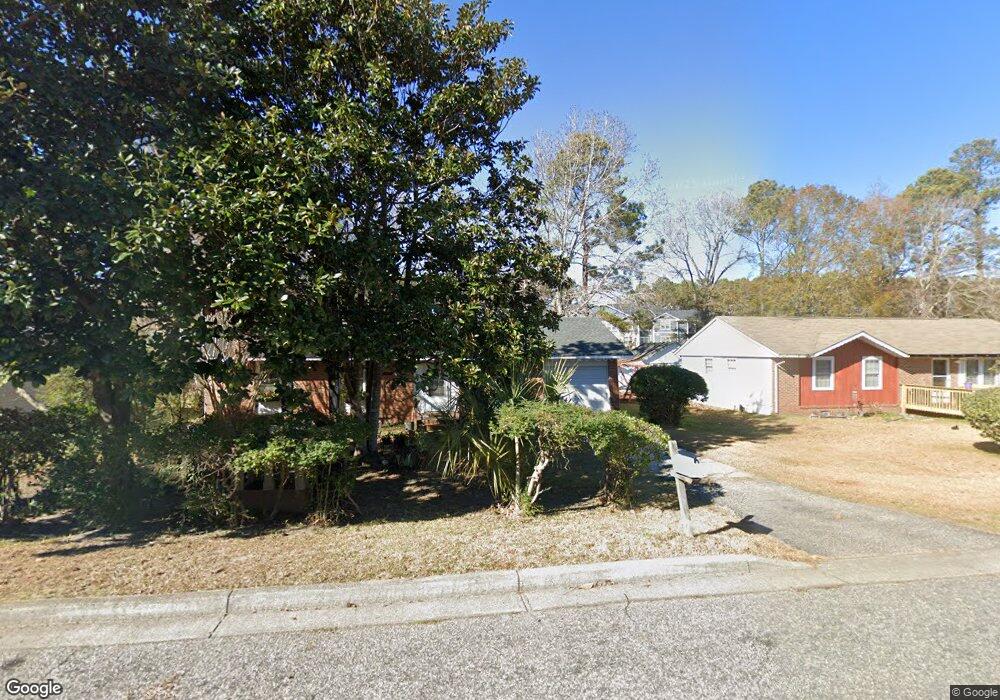
1109 Washington St Myrtle Beach, SC 29577
Downtown Myrtle Beach NeighborhoodEstimated Value: $147,000 - $181,000
3
Beds
1
Bath
1,092
Sq Ft
$153/Sq Ft
Est. Value
About This Home
This home is located at 1109 Washington St, Myrtle Beach, SC 29577 and is currently estimated at $167,435, approximately $153 per square foot. 1109 Washington St is a home located in Horry County with nearby schools including Myrtle Beach Child Development Center, Myrtle Beach Primary School, and Myrtle Beach Elementary School.
Ownership History
Date
Name
Owned For
Owner Type
Purchase Details
Closed on
Jun 24, 2002
Sold by
Lambert K Y
Bought by
Johnson Sarah R
Current Estimated Value
Home Financials for this Owner
Home Financials are based on the most recent Mortgage that was taken out on this home.
Original Mortgage
$54,000
Outstanding Balance
$30,030
Interest Rate
11.5%
Mortgage Type
Purchase Money Mortgage
Estimated Equity
$137,405
Purchase Details
Closed on
Jul 5, 2001
Sold by
Williams Jesse
Bought by
Lambert K Y
Purchase Details
Closed on
Jan 2, 2001
Sold by
Williams Theodric
Bought by
Lambert K Y
Purchase Details
Closed on
Aug 26, 1999
Sold by
Waters Gloria J and Williams Theodric
Bought by
Lambert K Y
Home Financials for this Owner
Home Financials are based on the most recent Mortgage that was taken out on this home.
Original Mortgage
$20,000
Interest Rate
7.73%
Mortgage Type
Purchase Money Mortgage
Purchase Details
Closed on
Nov 19, 1997
Sold by
Williams Jesse
Bought by
Williams Theodric
Create a Home Valuation Report for This Property
The Home Valuation Report is an in-depth analysis detailing your home's value as well as a comparison with similar homes in the area
Home Values in the Area
Average Home Value in this Area
Purchase History
| Date | Buyer | Sale Price | Title Company |
|---|---|---|---|
| Johnson Sarah R | $60,000 | -- | |
| Lambert K Y | -- | -- | |
| Lambert K Y | -- | -- | |
| Lambert K Y | $9,000 | -- | |
| Williams Theodric | $15,000 | -- |
Source: Public Records
Mortgage History
| Date | Status | Borrower | Loan Amount |
|---|---|---|---|
| Open | Johnson Sarah R | $54,000 | |
| Previous Owner | Lambert K Y | $20,000 |
Source: Public Records
Tax History Compared to Growth
Tax History
| Year | Tax Paid | Tax Assessment Tax Assessment Total Assessment is a certain percentage of the fair market value that is determined by local assessors to be the total taxable value of land and additions on the property. | Land | Improvement |
|---|---|---|---|---|
| 2024 | $125 | $5,714 | $3,400 | $2,314 |
| 2023 | $125 | $2,956 | $857 | $2,099 |
| 2021 | $89 | $3,419 | $1,067 | $2,352 |
| 2020 | $77 | $3,419 | $1,067 | $2,352 |
| 2019 | $74 | $3,419 | $1,067 | $2,352 |
| 2018 | $45 | $2,571 | $743 | $1,828 |
| 2017 | $44 | $2,571 | $743 | $1,828 |
| 2016 | -- | $2,571 | $743 | $1,828 |
| 2015 | $43 | $2,571 | $743 | $1,828 |
| 2014 | $39 | $2,571 | $743 | $1,828 |
Source: Public Records
Map
Nearby Homes
- 1211 Washington St
- (1.5 Acres) 10th Ave N
- 1102 Spivey Ave
- 1001 Graham Ave
- 1301 King St
- 1301 Hemingway St
- 1112 Ocala St
- 1104 Dunbar St
- 913 White St
- TBD Acline Ave
- 1101 Carver St
- Tbd Farrow Pkwy
- 1414 Dunbar St Unit 12
- 2000 Greens Blvd Unit 36-A
- 2000 Greens Blvd Unit 15C
- 2000 Greens Blvd Unit 24C
- 2000 Greens Blvd Unit 40C
- 2000 Greens Blvd Unit 18-D
- 2000 Greens Blvd
- 2000 Greens Blvd Unit 29-D
- 1107 Washington St
- 1111 Washington St
- 1105 Washington St
- 1113 Washington St
- 1108 Washington St
- 1110 Washington St
- 1106 Washington St
- 1103 Washington St
- 1112 Washington St
- 1104 Washington St
- 1212 Washington St
- 1212 Washington St
- 1212 Washington St
- 1102 Washington St
- 1101 Washington St
- 1015 Vereen Ave
- 1201 Washington St
- 1109 Ragin St
- 1111 Ragin St
- 1105 Ragin St