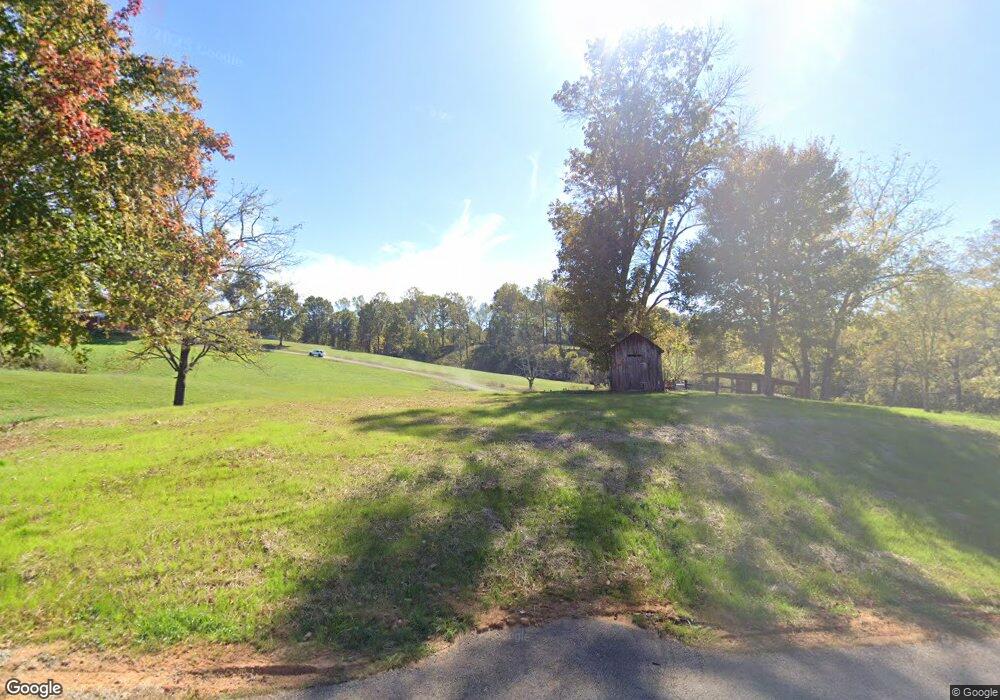
1109 Wildcat Rd Sparta, TN 38583
Estimated Value: $279,000 - $478,656
--
Bed
--
Bath
924
Sq Ft
$414/Sq Ft
Est. Value
About This Home
This home is located at 1109 Wildcat Rd, Sparta, TN 38583 and is currently estimated at $382,219, approximately $413 per square foot. 1109 Wildcat Rd is a home located in White County with nearby schools including Northfield Elementary School, White County Middle School, and White County High School.
Ownership History
Date
Name
Owned For
Owner Type
Purchase Details
Closed on
Jan 20, 2023
Sold by
Holzhausen Sonja H
Bought by
Holzhausen Sonja H and Mccoin Rita
Current Estimated Value
Purchase Details
Closed on
Dec 3, 2020
Sold by
Schwarz Nancy Lynn and Mills Kimberly Lynn
Bought by
Schwarz Nancy Lynn and Mills Kimberly Lynn
Purchase Details
Closed on
Nov 13, 2015
Sold by
Schwarz Nancy Lynn
Bought by
Lynn Mills Kimberly and Schwarz Nancy Lynn
Purchase Details
Closed on
Feb 8, 2013
Sold by
Schwarz Nancy Lynn
Bought by
Schwarz Nancy Lynn and Mills Kimberly Lynn
Purchase Details
Closed on
Dec 15, 1998
Bought by
Schwarz Nancy
Purchase Details
Closed on
Feb 11, 1993
Bought by
Schwarz Nancy
Purchase Details
Closed on
Feb 4, 1991
Bought by
Holzhausen Sonya H Nancy Schwarz
Purchase Details
Closed on
Nov 4, 1983
Bought by
Holzhausen Sonya H
Create a Home Valuation Report for This Property
The Home Valuation Report is an in-depth analysis detailing your home's value as well as a comparison with similar homes in the area
Home Values in the Area
Average Home Value in this Area
Purchase History
| Date | Buyer | Sale Price | Title Company |
|---|---|---|---|
| Holzhausen Sonja H | -- | -- | |
| Holzhausen Sonja H | -- | None Listed On Document | |
| Schwarz Nancy Lynn | -- | None Available | |
| Schwarz Nancy Lynn | -- | None Available | |
| Lynn Mills Kimberly | -- | -- | |
| Schwarz Nancy Lynn | -- | -- | |
| Schwarz Nancy | $4,200 | -- | |
| Schwarz Nancy | $32,000 | -- | |
| Holzhausen Sonya H Nancy Schwarz | -- | -- | |
| Holzhausen Sonya H | -- | -- |
Source: Public Records
Tax History Compared to Growth
Tax History
| Year | Tax Paid | Tax Assessment Tax Assessment Total Assessment is a certain percentage of the fair market value that is determined by local assessors to be the total taxable value of land and additions on the property. | Land | Improvement |
|---|---|---|---|---|
| 2025 | $2,119 | $168,225 | $0 | $0 |
| 2024 | $2,119 | $103,375 | $14,225 | $89,150 |
| 2023 | $580 | $28,275 | $14,225 | $14,050 |
| 2022 | $580 | $28,275 | $14,225 | $14,050 |
| 2021 | $580 | $28,275 | $14,225 | $14,050 |
| 2020 | $580 | $28,275 | $14,225 | $14,050 |
| 2019 | $541 | $26,375 | $12,825 | $13,550 |
| 2018 | $318 | $26,375 | $12,825 | $13,550 |
| 2017 | $318 | $15,500 | $6,750 | $8,750 |
| 2016 | $318 | $15,500 | $6,750 | $8,750 |
| 2015 | $287 | $15,500 | $6,750 | $8,750 |
| 2014 | -- | $15,500 | $6,750 | $8,750 |
| 2013 | -- | $14,900 | $6,750 | $8,150 |
Source: Public Records
Map
Nearby Homes
- 377 Margot Dr
- 19.267ac Wildcat Rd
- 5860 Canoe Way
- 5881 Canoe Way
- 43 Eli Ln
- 9510 Medlin Rd
- 9360 Medlin Rd
- 19 Caleb Way
- 3524 Griffintown Rd
- 14 Caleb Way
- 15 Caleb Way
- 16 Caleb Way
- 18 Caleb Way
- 8272 Burgess Falls Rd
- 7550 Old Mill Rd
- 41 Eli
- 0 H O Allison Rd Unit RTC2784203
- 0 H O Allison Rd Unit RTC3033979
- 0 H O Allison Rd Unit RTC2887900
- 0 Eli Ln Unit RTC3045610
- 1109 Wildcat Rd
- 1046 Wildcat Rd
- 1367 Wildcat Rd
- 885 Wildcat Rd
- 1308 Wildcat Rd
- 375 Cane Hollow Ln
- 0 Cane Hollow Ln Unit 639366
- 740 Wildcat Rd
- 75.21 ac Cane Hollow Rd
- 122.5 ac Cane Hollow Rd
- 291 Dunn Rd
- 655 Wildcat Rd
- 109 Dunn Rd
- 1580 Wildcat Rd
- 2243 Wildcat Rd
- 329 Dunn Rd
- lot 15 Wildcat Rd
- Lot 16 Wildcat Rd
- lot 14 Wildcat Rd
- lot 20 Wildcat Rd