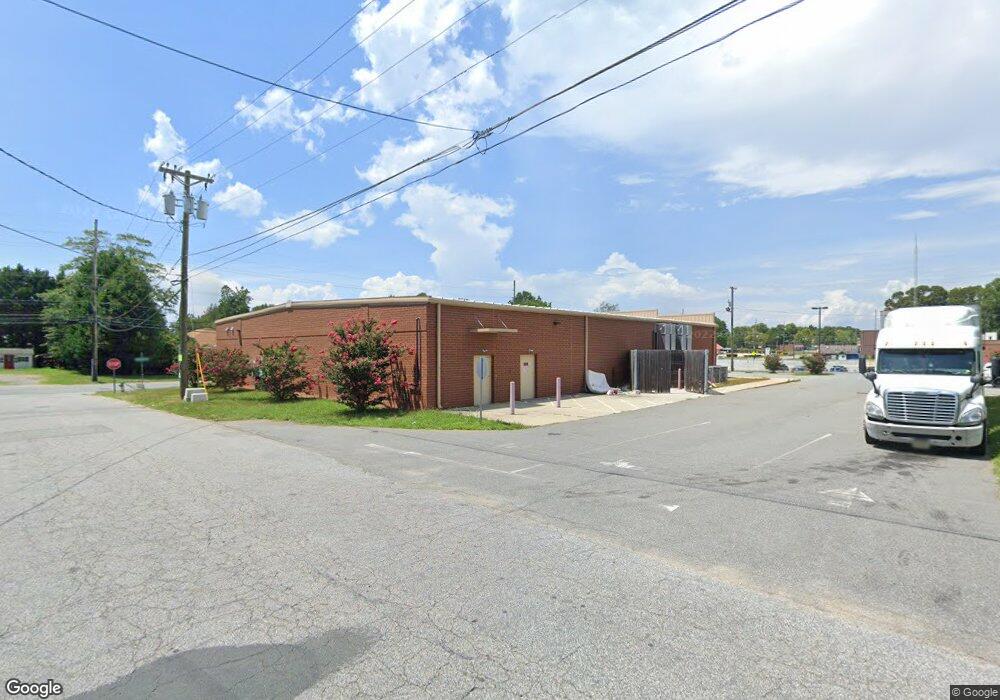
1109 Winston Rd Lexington, NC 27295
Estimated Value: $333,000
--
Bed
1
Bath
2,640
Sq Ft
$126/Sq Ft
Est. Value
About This Home
This home is located at 1109 Winston Rd, Lexington, NC 27295 and is currently estimated at $333,000, approximately $126 per square foot. 1109 Winston Rd is a home located in Davidson County with nearby schools including South Lexington School, Lexington Middle School, and Lexington Senior High School.
Ownership History
Date
Name
Owned For
Owner Type
Purchase Details
Closed on
Oct 29, 2014
Sold by
Wennonah Realty Co
Bought by
Red Fds Llc
Current Estimated Value
Home Financials for this Owner
Home Financials are based on the most recent Mortgage that was taken out on this home.
Original Mortgage
$222,642
Outstanding Balance
$172,172
Interest Rate
4.26%
Mortgage Type
Commercial
Estimated Equity
$160,828
Purchase Details
Closed on
Oct 11, 2013
Sold by
Wilson Frances T
Bought by
Wennonah Realty Company
Purchase Details
Closed on
Nov 9, 1999
Bought by
Wilson Frances T
Create a Home Valuation Report for This Property
The Home Valuation Report is an in-depth analysis detailing your home's value as well as a comparison with similar homes in the area
Home Values in the Area
Average Home Value in this Area
Purchase History
| Date | Buyer | Sale Price | Title Company |
|---|---|---|---|
| Red Fds Llc | $550,000 | None Available | |
| Wennonah Realty Company | $350,000 | None Available | |
| Wilson Frances T | -- | -- |
Source: Public Records
Mortgage History
| Date | Status | Borrower | Loan Amount |
|---|---|---|---|
| Open | Red Fds Llc | $222,642 | |
| Closed | Red Fds Llc | $1,241,000 |
Source: Public Records
Tax History Compared to Growth
Tax History
| Year | Tax Paid | Tax Assessment Tax Assessment Total Assessment is a certain percentage of the fair market value that is determined by local assessors to be the total taxable value of land and additions on the property. | Land | Improvement |
|---|---|---|---|---|
| 2025 | $3,664 | $281,830 | $0 | $0 |
| 2024 | $3,664 | $281,830 | $0 | $0 |
| 2023 | $3,664 | $281,830 | $0 | $0 |
| 2022 | $25,515 | $1,962,540 | $0 | $0 |
| 2021 | $25,515 | $1,962,540 | $0 | $0 |
| 2020 | $21,448 | $1,662,150 | $0 | $0 |
| 2019 | $21,774 | $1,662,150 | $0 | $0 |
| 2018 | $21,772 | $1,661,950 | $0 | $0 |
| 2017 | $21,772 | $1,661,950 | $0 | $0 |
| 2016 | $21,772 | $1,661,950 | $0 | $0 |
| 2015 | $6,854 | $543,950 | $0 | $0 |
| 2014 | $4,403 | $349,440 | $0 | $0 |
Source: Public Records
Map
Nearby Homes