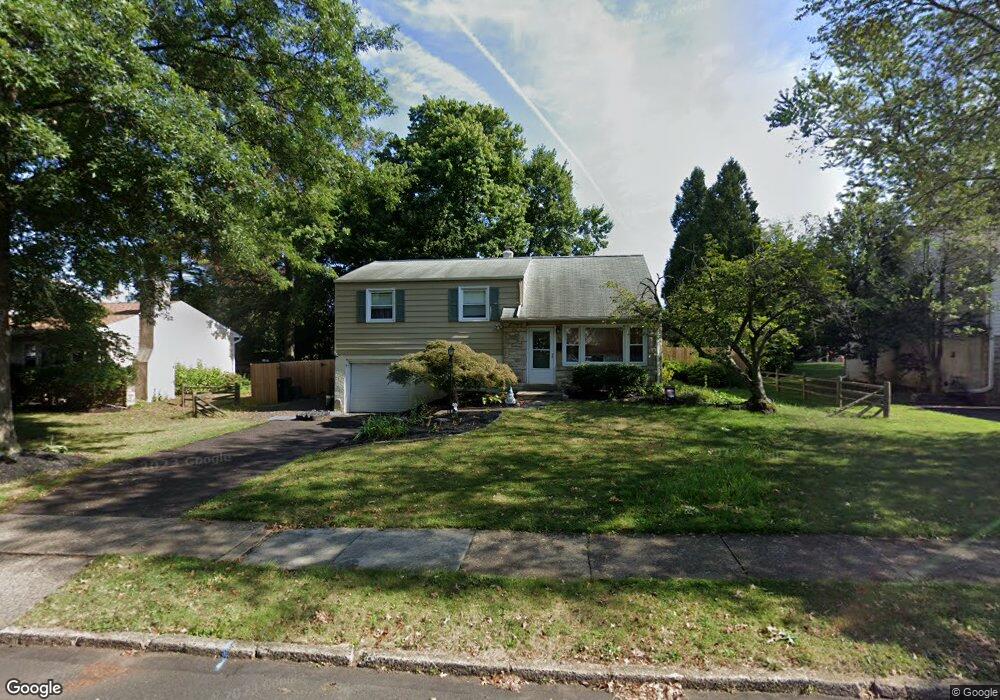
1109 York Ave Lansdale, PA 19446
Estimated Value: $431,000 - $454,000
3
Beds
1
Bath
1,522
Sq Ft
$288/Sq Ft
Est. Value
About This Home
This home is located at 1109 York Ave, Lansdale, PA 19446 and is currently estimated at $438,356, approximately $288 per square foot. 1109 York Ave is a home located in Montgomery County with nearby schools including Inglewood Elementary School, Penndale Middle School, and North Penn Senior High School.
Ownership History
Date
Name
Owned For
Owner Type
Purchase Details
Closed on
Jan 20, 2023
Sold by
Faikish Jeffrey
Bought by
Faikish Jennifer
Current Estimated Value
Purchase Details
Closed on
Jun 21, 2007
Sold by
Comber Bridget and Wilen John
Bought by
Faikish Jennifer
Home Financials for this Owner
Home Financials are based on the most recent Mortgage that was taken out on this home.
Original Mortgage
$227,920
Interest Rate
6.39%
Purchase Details
Closed on
Nov 28, 2003
Sold by
Ann L Minarick Revoc Tr and Minarick Ann L
Bought by
Wilen John and Comber Bridget
Home Financials for this Owner
Home Financials are based on the most recent Mortgage that was taken out on this home.
Original Mortgage
$172,000
Interest Rate
5.9%
Purchase Details
Closed on
Sep 28, 2001
Sold by
Minarick Ann L
Bought by
The Ann Ludwig Minarick Revocable Trust
Create a Home Valuation Report for This Property
The Home Valuation Report is an in-depth analysis detailing your home's value as well as a comparison with similar homes in the area
Home Values in the Area
Average Home Value in this Area
Purchase History
| Date | Buyer | Sale Price | Title Company |
|---|---|---|---|
| Faikish Jennifer | -- | None Listed On Document | |
| Faikish Jennifer | $284,900 | None Available | |
| Wilen John | $215,000 | -- | |
| The Ann Ludwig Minarick Revocable Trust | -- | -- |
Source: Public Records
Mortgage History
| Date | Status | Borrower | Loan Amount |
|---|---|---|---|
| Previous Owner | Faikish Jennifer | $227,920 | |
| Previous Owner | Wilen John | $172,000 |
Source: Public Records
Tax History Compared to Growth
Tax History
| Year | Tax Paid | Tax Assessment Tax Assessment Total Assessment is a certain percentage of the fair market value that is determined by local assessors to be the total taxable value of land and additions on the property. | Land | Improvement |
|---|---|---|---|---|
| 2025 | $5,024 | $124,020 | $49,430 | $74,590 |
| 2024 | $5,024 | $124,020 | $49,430 | $74,590 |
| 2023 | $4,810 | $124,020 | $49,430 | $74,590 |
| 2022 | $4,515 | $124,020 | $49,430 | $74,590 |
| 2021 | $4,385 | $124,020 | $49,430 | $74,590 |
| 2020 | $4,186 | $124,020 | $49,430 | $74,590 |
| 2019 | $4,113 | $124,020 | $49,430 | $74,590 |
| 2018 | $949 | $124,020 | $49,430 | $74,590 |
| 2017 | $3,950 | $124,020 | $49,430 | $74,590 |
| 2016 | $3,901 | $124,020 | $49,430 | $74,590 |
| 2015 | $3,738 | $124,020 | $49,430 | $74,590 |
| 2014 | $3,738 | $124,020 | $49,430 | $74,590 |
Source: Public Records
Map
Nearby Homes
- 1061 York Ave
- 340 Central Dr
- 217 Cherry Ln
- 245 Cherry Ln
- 13 W End Dr
- 108 Allison Ct Unit 8
- 21 S Valley Forge Rd Unit 213
- 831 W Main St
- 204 N Valley Forge Rd Unit 7B
- 1035 Forest Ave
- 1025 Birch St
- 1028 Poplar St Unit 75
- 625 Derstine Ave
- 833 W 4th St
- 750 Annes Ct
- 405 Derstine Ave
- 1107 Jarvis Ln
- 532 Green St
- 534 Green St
- 129 W Fifth St
- 1105 York Ave
- 1108 Columbia Ave
- 1112 Columbia Ave
- 1101 York Ave
- 1117 York Ave
- 1104 Columbia Ave
- 1108 York Ave
- 1112 York Ave
- 1116 Columbia Ave
- 1069 York Ave
- 1100 Columbia Ave
- 304 Central Dr
- 1060 Columbia Ave
- 307 Erie Dr
- 304 Erie Dr
- 300 Erie Dr
- 1105 Columbia Ave
- 1056 Columbia Ave
- 1109 Columbia Ave
- 1113 Columbia Ave