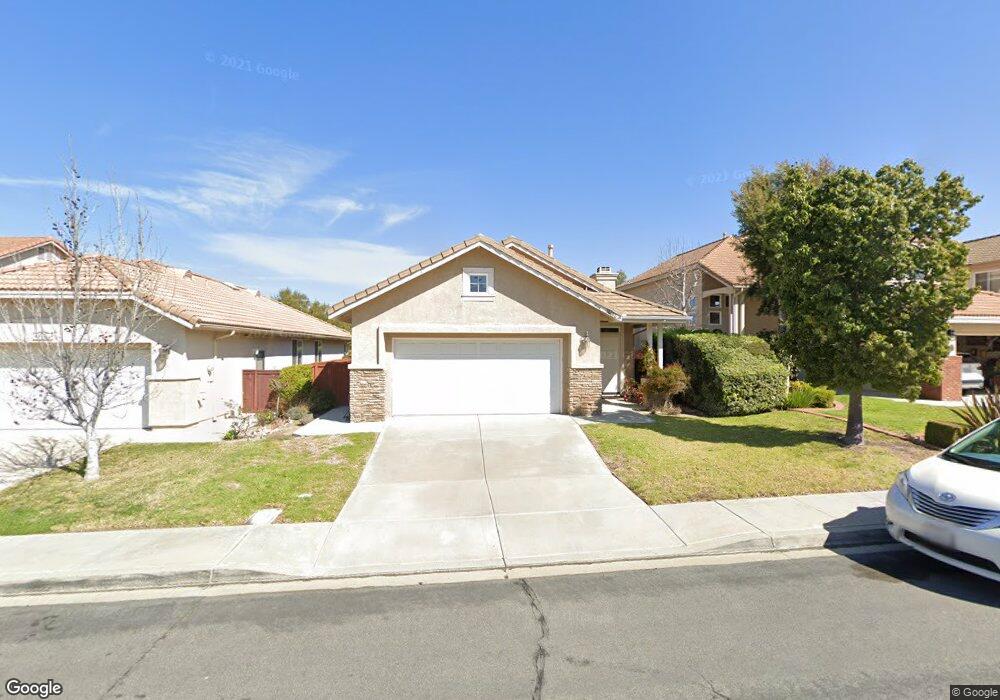
11092 Doverhill Rd Unit 6 San Diego, CA 92131
Miramar Ranch North NeighborhoodEstimated Value: $1,134,000 - $1,436,000
3
Beds
2
Baths
1,404
Sq Ft
$897/Sq Ft
Est. Value
About This Home
This home is located at 11092 Doverhill Rd Unit 6, San Diego, CA 92131 and is currently estimated at $1,259,484, approximately $897 per square foot. 11092 Doverhill Rd Unit 6 is a home located in San Diego County with nearby schools including Dingeman Elementary School, Thurgood Marshall Middle School, and Scripps Ranch High School.
Ownership History
Date
Name
Owned For
Owner Type
Purchase Details
Closed on
Oct 28, 2022
Sold by
Phinney Richard Martin and Rose Ann
Bought by
Richard M Phinney And Rose Ann Elizabeth Burk
Current Estimated Value
Purchase Details
Closed on
Apr 4, 2013
Sold by
Phinney Richard Martin and Phinney Richard M
Bought by
Phinney Richard Martin and Burke Rose Ann Elizabeth
Purchase Details
Closed on
May 9, 2001
Sold by
Lingo Scott W and Lingo Yukario O
Bought by
Phinney Richard M
Home Financials for this Owner
Home Financials are based on the most recent Mortgage that was taken out on this home.
Original Mortgage
$173,000
Interest Rate
7.14%
Purchase Details
Closed on
Sep 12, 1996
Sold by
Mcmillin Homes Ii Inc
Bought by
Lingo Scott W and Lingo Yukari O
Home Financials for this Owner
Home Financials are based on the most recent Mortgage that was taken out on this home.
Original Mortgage
$181,355
Interest Rate
7.87%
Create a Home Valuation Report for This Property
The Home Valuation Report is an in-depth analysis detailing your home's value as well as a comparison with similar homes in the area
Home Values in the Area
Average Home Value in this Area
Purchase History
| Date | Buyer | Sale Price | Title Company |
|---|---|---|---|
| Richard M Phinney And Rose Ann Elizabeth Burk | -- | -- | |
| Phinney Richard Martin | -- | Lawyers Title Sd | |
| Phinney Richard M | $338,000 | Lawyers Title | |
| Lingo Scott W | $191,000 | -- |
Source: Public Records
Mortgage History
| Date | Status | Borrower | Loan Amount |
|---|---|---|---|
| Previous Owner | Phinney Richard M | $173,000 | |
| Previous Owner | Lingo Scott W | $181,355 |
Source: Public Records
Tax History Compared to Growth
Tax History
| Year | Tax Paid | Tax Assessment Tax Assessment Total Assessment is a certain percentage of the fair market value that is determined by local assessors to be the total taxable value of land and additions on the property. | Land | Improvement |
|---|---|---|---|---|
| 2025 | $6,464 | $509,289 | $213,423 | $295,866 |
| 2024 | $6,464 | $499,304 | $209,239 | $290,065 |
| 2023 | $6,310 | $489,515 | $205,137 | $284,378 |
| 2022 | $6,077 | $479,917 | $201,115 | $278,802 |
| 2021 | $6,022 | $470,508 | $197,172 | $273,336 |
| 2020 | $5,952 | $465,685 | $195,151 | $270,534 |
| 2019 | $6,061 | $456,555 | $191,325 | $265,230 |
| 2018 | $6,196 | $447,604 | $187,574 | $260,030 |
| 2017 | $80 | $438,829 | $183,897 | $254,932 |
| 2016 | $5,998 | $430,226 | $180,292 | $249,934 |
| 2015 | $5,922 | $423,764 | $177,584 | $246,180 |
| 2014 | $5,838 | $415,464 | $174,106 | $241,358 |
Source: Public Records
Map
Nearby Homes
- 10941 Waterton Rd
- 10818 Caminito Arcada
- 11629 Swan Lake Dr Unit 4
- 10616 Falcon Rim Point
- 11793 Alderhill Terrace
- 10914 Ivy Hill Dr Unit 1
- 10535 Arbor Park Place
- 11825 Miro Cir
- 10415 Mesa Madera Dr
- 11856 Miro Cir
- 10473 Crosscreek Terrace
- 11954 Cypress Valley Dr
- 10405 White Birch Dr
- 10304 Crosscreek Terrace
- 10466 Ridgewater Ln
- 11482 Cortina Place
- 11365 Affinity Ct Unit 192
- 11215 Affinity Ct Unit 80
- 11175 Affinity Ct Unit 45
- 11115 Affinity Ct Unit 1
- 11086 Doverhill Rd Unit 165
- 11102 Doverhill Rd
- 11080 Doverhill Rd
- 11108 Doverhill Rd
- 11083 Roxboro Rd
- 11079 Roxboro Rd
- 11087 Roxboro Rd
- 11072 Doverhill Rd
- 11116 Doverhill Rd
- 11075 Roxboro Rd
- 11093 Doverhill Rd Unit 6
- 11091 Roxboro Rd
- 11101 Doverhill Rd
- 11071 Roxboro Rd
- 11089 Doverhill Rd
- 11064 Doverhill Rd
- 11122 Doverhill Rd
- 11087 Doverhill Rd
- 11113 Doverhill Rd
- 11093 Roxboro Rd