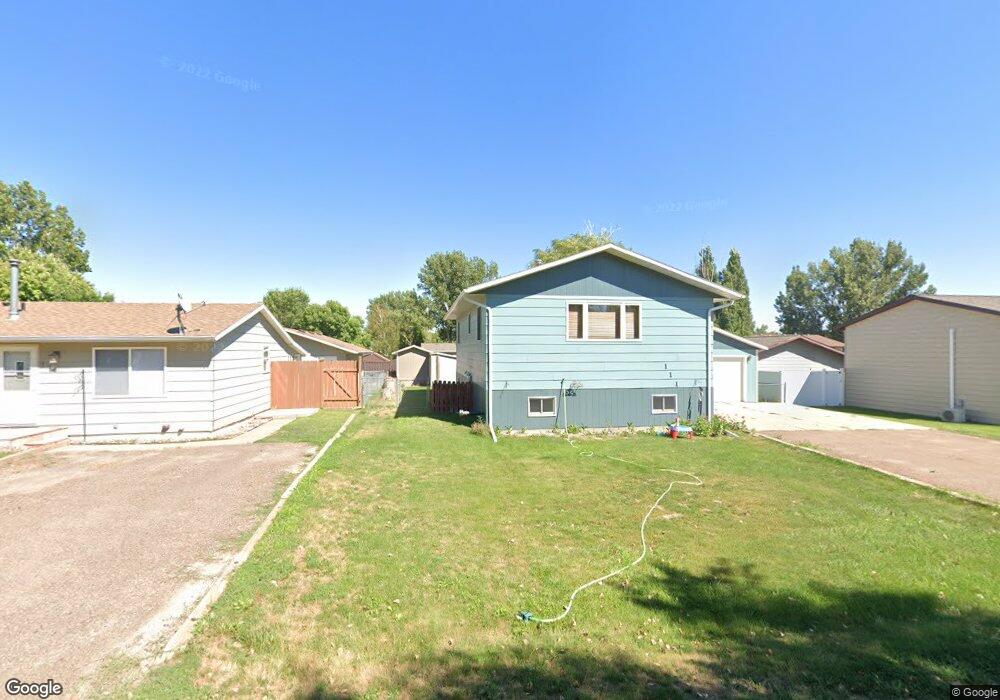
111 4th St Glendive, MT 59330
Estimated Value: $224,000 - $279,293
3
Beds
2
Baths
1,008
Sq Ft
$247/Sq Ft
Est. Value
About This Home
This home is located at 111 4th St, Glendive, MT 59330 and is currently estimated at $249,323, approximately $247 per square foot. 111 4th St is a home located in Dawson County with nearby schools including Dawson High School and Valley View Seventh-day Adventist School.
Ownership History
Date
Name
Owned For
Owner Type
Purchase Details
Closed on
Mar 28, 2017
Sold by
Secretary Of Housing & Urban Dev
Bought by
Reynolds Christopher Lee and Reynolds Melissa Renee
Current Estimated Value
Home Financials for this Owner
Home Financials are based on the most recent Mortgage that was taken out on this home.
Original Mortgage
$116,000
Outstanding Balance
$96,424
Interest Rate
4.17%
Mortgage Type
New Conventional
Estimated Equity
$152,899
Purchase Details
Closed on
Jan 15, 2010
Bought by
Lumpkins Timothy Dean
Create a Home Valuation Report for This Property
The Home Valuation Report is an in-depth analysis detailing your home's value as well as a comparison with similar homes in the area
Home Values in the Area
Average Home Value in this Area
Purchase History
| Date | Buyer | Sale Price | Title Company |
|---|---|---|---|
| Reynolds Christopher Lee | $145,100 | -- | |
| Lumpkins Timothy Dean | -- | -- |
Source: Public Records
Mortgage History
| Date | Status | Borrower | Loan Amount |
|---|---|---|---|
| Open | Reynolds Christopher Lee | $116,000 | |
| Closed | Reynolds Christopher Lee | $116,000 |
Source: Public Records
Tax History
| Year | Tax Paid | Tax Assessment Tax Assessment Total Assessment is a certain percentage of the fair market value that is determined by local assessors to be the total taxable value of land and additions on the property. | Land | Improvement |
|---|---|---|---|---|
| 2025 | $2,252 | $216,500 | $0 | $0 |
| 2024 | $2,897 | $185,300 | $0 | $0 |
| 2023 | $2,889 | $185,300 | $0 | $0 |
| 2022 | $2,685 | $168,600 | $0 | $0 |
| 2021 | $1,521 | $168,600 | $0 | $0 |
| 2020 | $1,756 | $143,700 | $0 | $0 |
| 2019 | $1,754 | $143,700 | $0 | $0 |
| 2018 | $2,688 | $201,600 | $0 | $0 |
| 2017 | $2,662 | $201,600 | $0 | $0 |
| 2016 | $2,512 | $164,400 | $0 | $0 |
| 2015 | $1,600 | $164,400 | $0 | $0 |
| 2014 | $1,150 | $66,568 | $0 | $0 |
Source: Public Records
Map
Nearby Homes
Your Personal Tour Guide
Ask me questions while you tour the home.