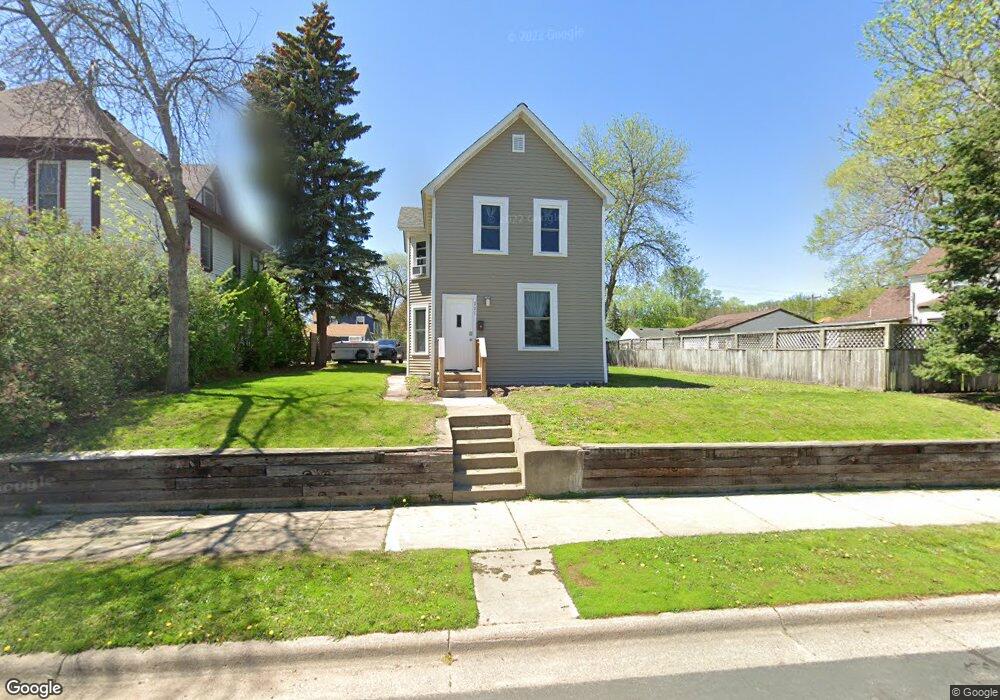
111 9th Ave N South Saint Paul, MN 55075
Estimated Value: $295,000 - $342,000
4
Beds
2
Baths
1,431
Sq Ft
$226/Sq Ft
Est. Value
About This Home
This home is located at 111 9th Ave N, South Saint Paul, MN 55075 and is currently estimated at $322,843, approximately $225 per square foot. 111 9th Ave N is a home located in Dakota County with nearby schools including Lincoln Center Elementary, South St. Paul Middle School, and South St. Paul Secondary.
Ownership History
Date
Name
Owned For
Owner Type
Purchase Details
Closed on
May 20, 2021
Sold by
Db Capital Llc
Bought by
Mann Angela Jean and Mann Keith Wayne
Current Estimated Value
Home Financials for this Owner
Home Financials are based on the most recent Mortgage that was taken out on this home.
Original Mortgage
$294,566
Outstanding Balance
$179,708
Interest Rate
2.9%
Mortgage Type
Stand Alone Second
Estimated Equity
$143,135
Purchase Details
Closed on
Aug 25, 2020
Sold by
Turgeon Kenneth and Turheon Kenneth
Bought by
Db Capital Llc
Home Financials for this Owner
Home Financials are based on the most recent Mortgage that was taken out on this home.
Original Mortgage
$72,639
Interest Rate
2.9%
Mortgage Type
New Conventional
Create a Home Valuation Report for This Property
The Home Valuation Report is an in-depth analysis detailing your home's value as well as a comparison with similar homes in the area
Home Values in the Area
Average Home Value in this Area
Purchase History
| Date | Buyer | Sale Price | Title Company |
|---|---|---|---|
| Mann Angela Jean | $300,000 | Titlesmart Inc | |
| Db Capital Llc | $96,851 | Titlesmart Inc | |
| Mann Angela Angela | $300,000 | -- |
Source: Public Records
Mortgage History
| Date | Status | Borrower | Loan Amount |
|---|---|---|---|
| Open | Mann Angela Jean | $294,566 | |
| Closed | Mann Angela Jean | $294,566 | |
| Previous Owner | Db Capital Llc | $72,639 | |
| Closed | Mann Angela Angela | $289,500 |
Source: Public Records
Tax History Compared to Growth
Tax History
| Year | Tax Paid | Tax Assessment Tax Assessment Total Assessment is a certain percentage of the fair market value that is determined by local assessors to be the total taxable value of land and additions on the property. | Land | Improvement |
|---|---|---|---|---|
| 2024 | $3,838 | $285,100 | $67,400 | $217,700 |
| 2023 | $3,838 | $283,700 | $67,800 | $215,900 |
| 2022 | $2,612 | $273,800 | $67,800 | $206,000 |
| 2021 | $2,374 | $204,000 | $59,000 | $145,000 |
| 2020 | $2,326 | $184,800 | $56,100 | $128,700 |
| 2019 | $2,079 | $185,700 | $53,500 | $132,200 |
| 2018 | $2,059 | $162,900 | $48,600 | $114,300 |
| 2017 | $1,758 | $155,600 | $46,300 | $109,300 |
| 2016 | $1,874 | $140,100 | $42,100 | $98,000 |
| 2015 | $1,901 | $117,649 | $33,200 | $84,449 |
| 2014 | -- | $126,914 | $33,793 | $93,121 |
| 2013 | -- | $105,877 | $28,465 | $77,412 |
Source: Public Records
Map
Nearby Homes
- 119 10th Ave N
- 101 11th Ave N
- 212 11th Ave N
- 236 11th Ave S
- 308 10th Ave S
- 352 12th Ave N
- 100 4th Ave N Unit 112
- 351 12th Ave N
- 104 3rd Ave S
- 127 16th Ave S
- 221 Grand Ave W Unit 104
- 339 14th Ave S
- 417 13th Ave N
- 329 4th Ave S
- 348 4th Ave S
- 454 8th Ave S
- 438 6th Ave S
- 450 11th Ave S
- 456 10th Ave S
- 306 2nd Ave S
- 119 9th Ave N
- 107 9th Ave N
- 123 123 9th-Avenue-n
- 123 9th Ave N
- 112 10th Ave N
- 918 Marie Ave
- 832 Marie Ave
- 114 9th Ave N
- 129 9th Ave N
- 124 10th Ave N
- 118 9th Ave N
- 122 9th Ave N
- 126 10th Ave N
- 100 9th Ave S
- 124 9th Ave N
- 124 124 9th-Avenue-n
- 124 124 9th Ave N
- 135 135 9th Ave N
- 135 9th Ave N
- 826 Marie Ave