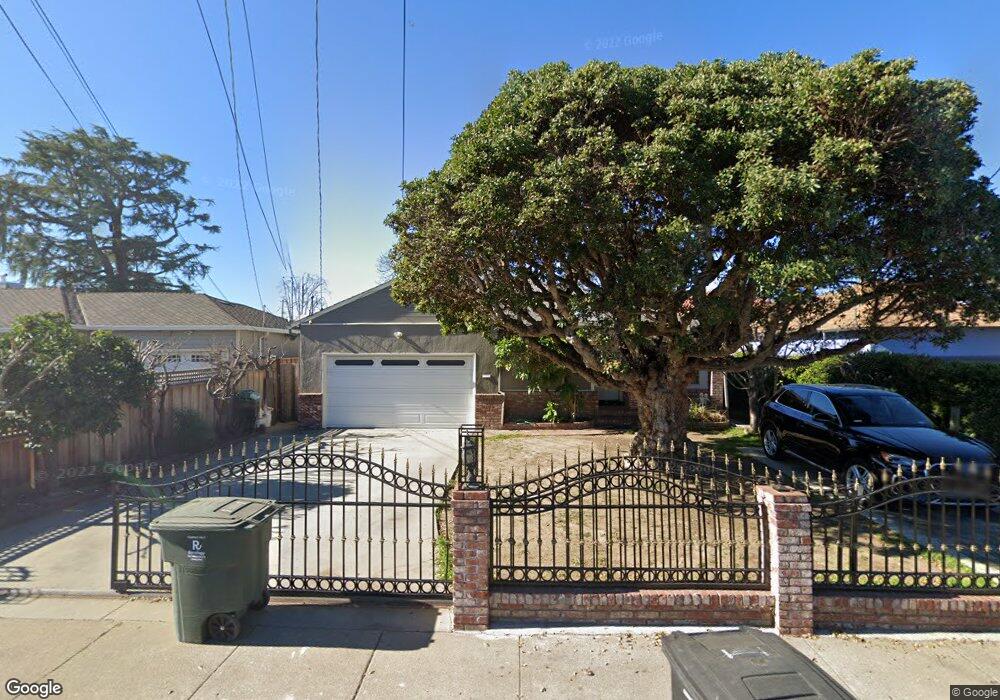
111 Abelia Way East Palo Alto, CA 94303
Estimated Value: $912,000 - $1,028,000
3
Beds
1
Bath
1,110
Sq Ft
$868/Sq Ft
Est. Value
About This Home
This home is located at 111 Abelia Way, East Palo Alto, CA 94303 and is currently estimated at $963,601, approximately $868 per square foot. 111 Abelia Way is a home located in San Mateo County with nearby schools including Brentwood Academy, Menlo-Atherton High School, and East Palo Alto Academy.
Ownership History
Date
Name
Owned For
Owner Type
Purchase Details
Closed on
Jul 1, 1999
Sold by
Ricardo Ahedo and Molina Jose M
Bought by
Molina J Carmen and Molina Luz M
Current Estimated Value
Purchase Details
Closed on
Oct 26, 1994
Sold by
Bruce David and Bruce Gordie Lee
Bought by
Transamerica Financial Services
Home Financials for this Owner
Home Financials are based on the most recent Mortgage that was taken out on this home.
Original Mortgage
$137,750
Interest Rate
5.75%
Purchase Details
Closed on
Oct 24, 1994
Sold by
Ahedo Mary Lucia Flores
Bought by
Ahedo Ricardo
Home Financials for this Owner
Home Financials are based on the most recent Mortgage that was taken out on this home.
Original Mortgage
$137,750
Interest Rate
5.75%
Purchase Details
Closed on
Sep 22, 1994
Sold by
Transamerica Financial Services
Bought by
Ahedo Ricardo and Molina Jose M
Home Financials for this Owner
Home Financials are based on the most recent Mortgage that was taken out on this home.
Original Mortgage
$137,750
Interest Rate
5.75%
Create a Home Valuation Report for This Property
The Home Valuation Report is an in-depth analysis detailing your home's value as well as a comparison with similar homes in the area
Home Values in the Area
Average Home Value in this Area
Purchase History
| Date | Buyer | Sale Price | Title Company |
|---|---|---|---|
| Molina J Carmen | -- | American Title | |
| Transamerica Financial Services | $126,300 | Stewart Title | |
| Ahedo Ricardo | -- | Stewart Title Of California | |
| Ahedo Ricardo | $145,000 | Stewart Title |
Source: Public Records
Mortgage History
| Date | Status | Borrower | Loan Amount |
|---|---|---|---|
| Previous Owner | Ahedo Ricardo | $137,750 |
Source: Public Records
Tax History Compared to Growth
Tax History
| Year | Tax Paid | Tax Assessment Tax Assessment Total Assessment is a certain percentage of the fair market value that is determined by local assessors to be the total taxable value of land and additions on the property. | Land | Improvement |
|---|---|---|---|---|
| 2025 | $6,267 | $422,644 | $211,322 | $211,322 |
| 2023 | $6,267 | $406,234 | $203,117 | $203,117 |
| 2022 | $5,790 | $398,270 | $199,135 | $199,135 |
| 2021 | $5,667 | $390,462 | $195,231 | $195,231 |
| 2020 | $5,573 | $386,460 | $193,230 | $193,230 |
| 2019 | $5,584 | $378,884 | $189,442 | $189,442 |
| 2018 | $5,464 | $371,456 | $185,728 | $185,728 |
| 2017 | $5,276 | $364,174 | $182,087 | $182,087 |
| 2016 | $5,260 | $357,034 | $178,517 | $178,517 |
| 2015 | $5,193 | $351,672 | $175,836 | $175,836 |
| 2014 | $5,087 | $344,784 | $172,392 | $172,392 |
Source: Public Records
Map
Nearby Homes
- 120 Gardenia Way
- 159 Jasmine Way
- 1982 W Bayshore Rd Unit 121
- 1982 W Bayshore Rd Unit 223
- 1893 Woodland Ave
- 1885 E Bayshore Rd Unit 37
- 1885 E Bayshore Rd Unit 71
- 1879 Woodland Ave
- 1101 Juana Ct
- 653 Wildwood Ln
- 956 Mouton Cir
- 1597 Edgewood Dr
- 2200 Saint Francis Dr
- 161 Primrose Way
- 61 Primrose Way
- 1168 Beech St
- 1788 E Bayshore Rd
- 2260 Pulgas Ave
- 1031 Amarillo Ave
- 90 Crescent Dr