Estimated Value: $587,289 - $618,000
4
Beds
3
Baths
2,489
Sq Ft
$244/Sq Ft
Est. Value
About This Home
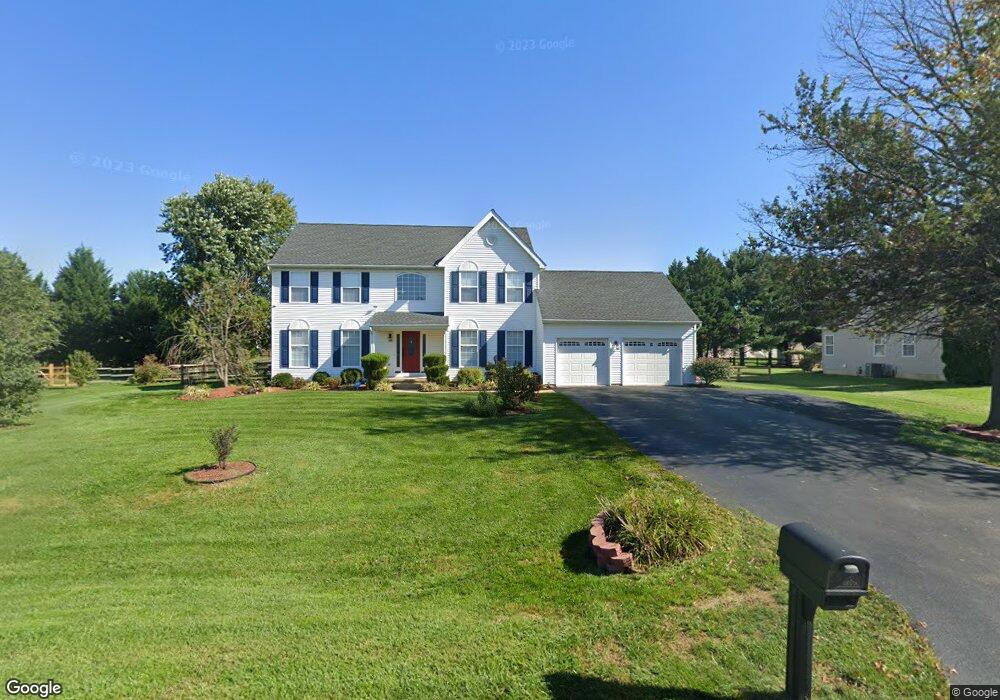
This home is located at 111 Ascot Ct, Bear, DE 19701 and is currently estimated at $606,072, approximately $243 per square foot. 111 Ascot Ct is a home located in New Castle County with nearby schools including Olive B. Loss Elementary School, Alfred G. Waters Middle School, and Appoquinimink High School.
Ownership History
Date
Name
Owned For
Owner Type
Purchase Details
Closed on
Feb 23, 1999
Bought by
Dempsey Susanne F
Current Estimated Value
Create a Home Valuation Report for This Property
The Home Valuation Report is an in-depth analysis detailing your home's value as well as a comparison with similar homes in the area
Home Values in the Area
Average Home Value in this Area
Purchase History
| Date | Buyer | Sale Price | Title Company |
|---|---|---|---|
| Dempsey Susanne F | -- | -- |
Source: Public Records
Tax History
| Year | Tax Paid | Tax Assessment Tax Assessment Total Assessment is a certain percentage of the fair market value that is determined by local assessors to be the total taxable value of land and additions on the property. | Land | Improvement |
|---|---|---|---|---|
| 2024 | $3,881 | $89,200 | $15,200 | $74,000 |
| 2023 | $3,331 | $89,200 | $15,200 | $74,000 |
| 2022 | $3,340 | $89,200 | $15,200 | $74,000 |
| 2021 | $3,300 | $89,200 | $15,200 | $74,000 |
| 2020 | $3,263 | $89,200 | $15,200 | $74,000 |
| 2019 | $3,110 | $89,200 | $15,200 | $74,000 |
| 2018 | $69 | $89,200 | $15,200 | $74,000 |
| 2017 | $2,566 | $89,200 | $15,200 | $74,000 |
| 2016 | $2,566 | $89,200 | $15,200 | $74,000 |
| 2015 | $2,498 | $89,200 | $15,200 | $74,000 |
| 2014 | $2,506 | $89,200 | $15,200 | $74,000 |
Source: Public Records
Map
Nearby Homes
- 15 Eaton Place
- 52 Eaton Place
- 2 Pegasus Place
- 7 Keeneland Ct
- 204 Pebblecreek Place
- 137 Hammersmith Way
- 48 Marble House Dr
- 1 Bohemia Rd
- 61 Rose Hill Dr
- 557 Mansion House Rd
- 2613 Old County Rd
- 25 Shawn Ln
- 2956 Frazer Rd
- 29 Sycamore Ln
- 103 Sarah Cir
- 1 Jasmine Dr
- 19 Hempstead Dr
- 1 Wortham Ct
- 95 Hempstead Dr
- 2664 Glasgow Ave
Your Personal Tour Guide
Ask me questions while you tour the home.