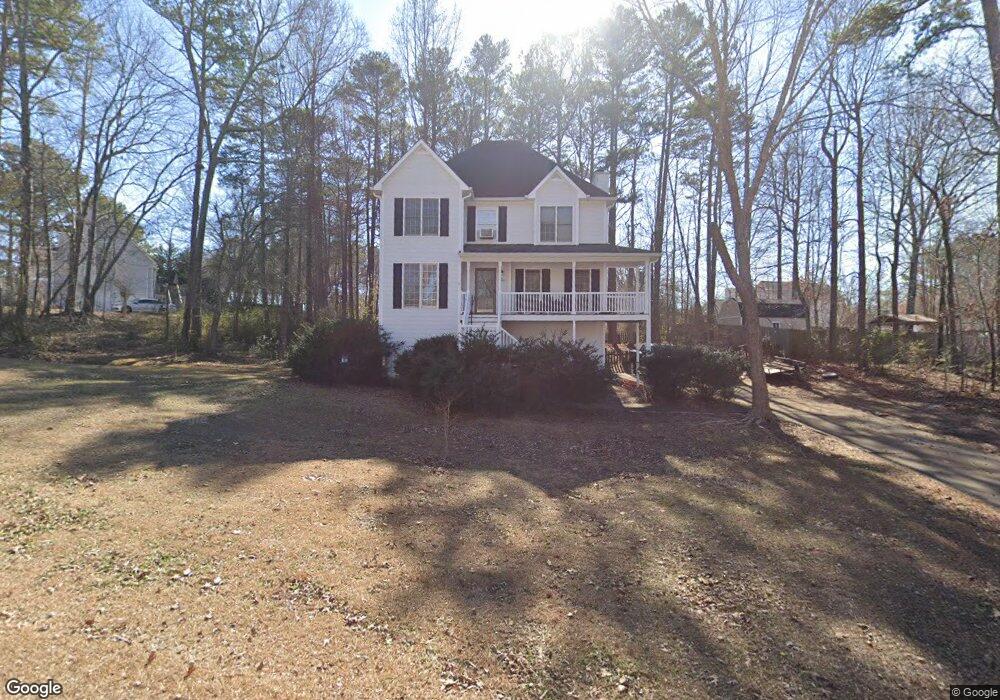
111 Berkeley Dr Douglasville, GA 30134
Estimated Value: $304,000 - $323,341
4
Beds
3
Baths
1,790
Sq Ft
$174/Sq Ft
Est. Value
About This Home
This home is located at 111 Berkeley Dr, Douglasville, GA 30134 and is currently estimated at $311,335, approximately $173 per square foot. 111 Berkeley Dr is a home located in Paulding County with nearby schools including Nebo Elementary School, Irma C. Austin Middle School, and South Paulding High School.
Ownership History
Date
Name
Owned For
Owner Type
Purchase Details
Closed on
Jun 25, 2018
Sold by
Porter Tami Fay
Bought by
Porter Keith H
Current Estimated Value
Purchase Details
Closed on
Apr 5, 2007
Sold by
Federal National Mortgage Association
Bought by
Porter Keith H and Porter Tami F
Home Financials for this Owner
Home Financials are based on the most recent Mortgage that was taken out on this home.
Original Mortgage
$141,900
Interest Rate
6.18%
Mortgage Type
New Conventional
Purchase Details
Closed on
Nov 8, 2006
Sold by
Regions Bank
Purchase Details
Closed on
Nov 7, 2006
Sold by
Regions Mtg
Bought by
Federal Natl Mtg Assn Fnma
Purchase Details
Closed on
Jun 24, 2004
Sold by
Naderi Parisa A
Purchase Details
Closed on
Apr 18, 2001
Sold by
Matheson Robert A
Purchase Details
Closed on
Oct 29, 1998
Sold by
Mdb Builders Inc
Purchase Details
Closed on
Jul 28, 1998
Sold by
Brooks James Michael
Purchase Details
Closed on
Mar 16, 1998
Sold by
Jmc Development Inc
Create a Home Valuation Report for This Property
The Home Valuation Report is an in-depth analysis detailing your home's value as well as a comparison with similar homes in the area
Home Values in the Area
Average Home Value in this Area
Purchase History
| Date | Buyer | Sale Price | Title Company |
|---|---|---|---|
| Porter Keith H | -- | -- | |
| Porter Keith H | -- | -- | |
| -- | -- | -- | |
| Federal Natl Mtg Assn Fnma | -- | -- | |
| Regions Mtg | $158,171 | -- | |
| -- | -- | -- | |
| -- | -- | -- | |
| -- | $130,000 | -- | |
| -- | $107,800 | -- | |
| -- | -- | -- | |
| -- | $11,400 | -- |
Source: Public Records
Mortgage History
| Date | Status | Borrower | Loan Amount |
|---|---|---|---|
| Previous Owner | Porter Keith H | $141,900 |
Source: Public Records
Tax History
| Year | Tax Paid | Tax Assessment Tax Assessment Total Assessment is a certain percentage of the fair market value that is determined by local assessors to be the total taxable value of land and additions on the property. | Land | Improvement |
|---|---|---|---|---|
| 2025 | $3,158 | $126,936 | $12,000 | $114,936 |
| 2024 | $2,859 | $114,944 | $12,000 | $102,944 |
| 2023 | $2,805 | $107,592 | $12,000 | $95,592 |
| 2022 | $2,236 | $85,764 | $12,000 | $73,764 |
| 2021 | $2,073 | $71,332 | $8,000 | $63,332 |
| 2020 | $1,922 | $64,704 | $8,000 | $56,704 |
| 2019 | $1,753 | $58,188 | $8,000 | $50,188 |
| 2018 | $1,648 | $56,560 | $9,600 | $46,960 |
| 2017 | $1,544 | $52,392 | $9,600 | $42,792 |
| 2016 | $1,257 | $43,428 | $9,600 | $33,828 |
| 2015 | $1,224 | $41,636 | $9,600 | $32,036 |
| 2014 | $1,101 | $36,748 | $9,600 | $27,148 |
| 2013 | -- | $33,320 | $9,600 | $23,720 |
Source: Public Records
Map
Nearby Homes
- 209 Peggy Meadows Way
- 46 Legend Creek Hollow
- 146 Flint Knoll
- 246 Hudson Cir
- 214 Bruce Rd
- 391 Hudson Cir
- 43 Legend Creek Walk
- 58 Glenn Eagles Way
- 3061 Dallas Nebo Rd
- 174 Ridge Brooke Ln
- 23 Bomar Ln
- 1050 Denton Rd
- 78 Marion Ln
- 70 Charity Dr
- 41 Bakers Bridge Cir
- 891 Nottingham Dr
- 49 Sonja Walk
- 1 Peach Forest Place
- 55 Gwendolyn Way
- 2203 Ridge Rd
Your Personal Tour Guide
Ask me questions while you tour the home.