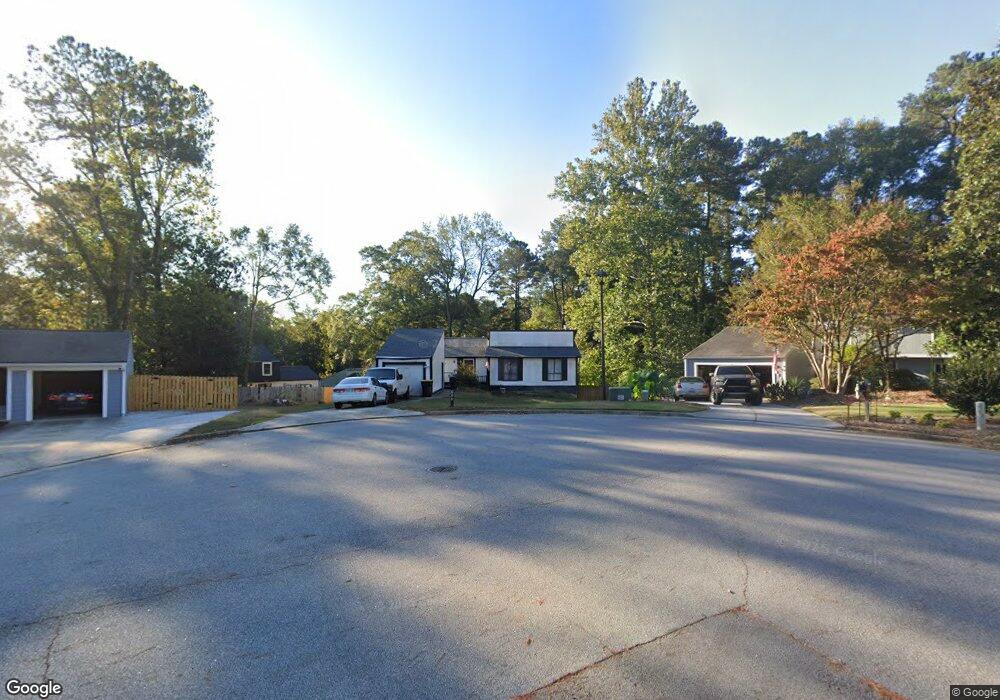
111 Butternut Ln Peachtree City, GA 30269
Estimated Value: $246,567 - $373,000
--
Bed
2
Baths
1,440
Sq Ft
$235/Sq Ft
Est. Value
About This Home
This home is located at 111 Butternut Ln, Peachtree City, GA 30269 and is currently estimated at $338,142, approximately $234 per square foot. 111 Butternut Ln is a home located in Fayette County with nearby schools including Oak Grove Elementary School, Rising Starr Middle School, and Starrs Mill High School.
Ownership History
Date
Name
Owned For
Owner Type
Purchase Details
Closed on
Oct 16, 2002
Sold by
Dennis Winfred L
Bought by
Dennis Elizabeth
Current Estimated Value
Purchase Details
Closed on
Mar 1, 2002
Sold by
Sec Of Hud
Bought by
Dennis Winfred L and Dennis Elizabeth M
Home Financials for this Owner
Home Financials are based on the most recent Mortgage that was taken out on this home.
Original Mortgage
$105,300
Interest Rate
9.63%
Mortgage Type
New Conventional
Purchase Details
Closed on
Sep 4, 2001
Sold by
Washington Mutal Home Loans
Bought by
Sec Of Hud
Purchase Details
Closed on
Feb 19, 1998
Sold by
Vaccaro Nicola and Vaccaro Mariangela
Bought by
Ragozzine William A and Monroe Marlene A
Home Financials for this Owner
Home Financials are based on the most recent Mortgage that was taken out on this home.
Original Mortgage
$106,851
Interest Rate
6.86%
Mortgage Type
FHA
Create a Home Valuation Report for This Property
The Home Valuation Report is an in-depth analysis detailing your home's value as well as a comparison with similar homes in the area
Home Values in the Area
Average Home Value in this Area
Purchase History
| Date | Buyer | Sale Price | Title Company |
|---|---|---|---|
| Dennis Elizabeth | -- | -- | |
| Dennis Winfred L | -- | -- | |
| Sec Of Hud | -- | -- | |
| Washington Mutual Home Loans | $110,349 | -- | |
| Ragozzine William A | $110,000 | -- |
Source: Public Records
Mortgage History
| Date | Status | Borrower | Loan Amount |
|---|---|---|---|
| Previous Owner | Dennis Winfred L | $105,300 | |
| Previous Owner | Ragozzine William A | $106,851 |
Source: Public Records
Tax History Compared to Growth
Tax History
| Year | Tax Paid | Tax Assessment Tax Assessment Total Assessment is a certain percentage of the fair market value that is determined by local assessors to be the total taxable value of land and additions on the property. | Land | Improvement |
|---|---|---|---|---|
| 2024 | $1,120 | $91,820 | $22,000 | $69,820 |
| 2023 | $608 | $88,400 | $22,000 | $66,400 |
| 2022 | $1,118 | $77,600 | $22,000 | $55,600 |
| 2021 | $1,090 | $79,040 | $22,000 | $57,040 |
| 2020 | $1,349 | $68,320 | $15,200 | $53,120 |
| 2019 | $1,582 | $89,520 | $15,200 | $74,320 |
| 2018 | $1,475 | $82,200 | $15,200 | $67,000 |
| 2017 | $1,781 | $83,360 | $15,200 | $68,160 |
| 2016 | $1,392 | $73,360 | $15,200 | $58,160 |
| 2015 | $1,539 | $67,560 | $15,200 | $52,360 |
| 2014 | $1,420 | $61,080 | $15,200 | $45,880 |
| 2013 | -- | $59,480 | $0 | $0 |
Source: Public Records
Map
Nearby Homes
- 124 Hickory Dr
- 709 Cove Rd
- 4 & 5 Northlake Cir
- 213 Cedar Dr
- 101 Bluegill Trace
- 401 Peachtree Club Dr
- 228 Terrane Ridge
- 104 Ridgefield Dr
- 102 Spincast Ct
- 107 Presidio Park
- 105 Highgreen Ridge
- 244 Terrane Ridge
- 217 Hilltop Dr
- 2006 Village Park Dr
- 444 Seabiscuit Walk Unit 55
- 442 Seabiscuit Walk
- 440 Seabiscuit Walk
- 164 Twiggs Corner
- 445 Seabisuit Walk
- 319 Ruffian Cir Unit 71
- 112 Butternut Ln
- 120 Sweetgum Rd
- 109 Butternut Ln
- 122 Sweetgum Rd
- 118 Sweetgum Rd
- 107 Butternut Ln
- 107 Butternut Ln Unit 17
- 124 Sweetgum Rd
- 110 Butternut Ln
- 116 Sweetgum Rd
- 108 Butternut Ln
- 106 Butternut Ln Unit 11
- 106 Butternut Ln Unit 20A
- 0 Butternut Ln Unit 8547895
- 0 Butternut Ln Unit 8445247
- 0 Butternut Ln Unit 3167015
- 0 Butternut Ln Unit 3200065
- 0 Butternut Ln Unit 8772826
- 0 Butternut Ln Unit 3204081
- 0 Butternut Ln Unit 7505702