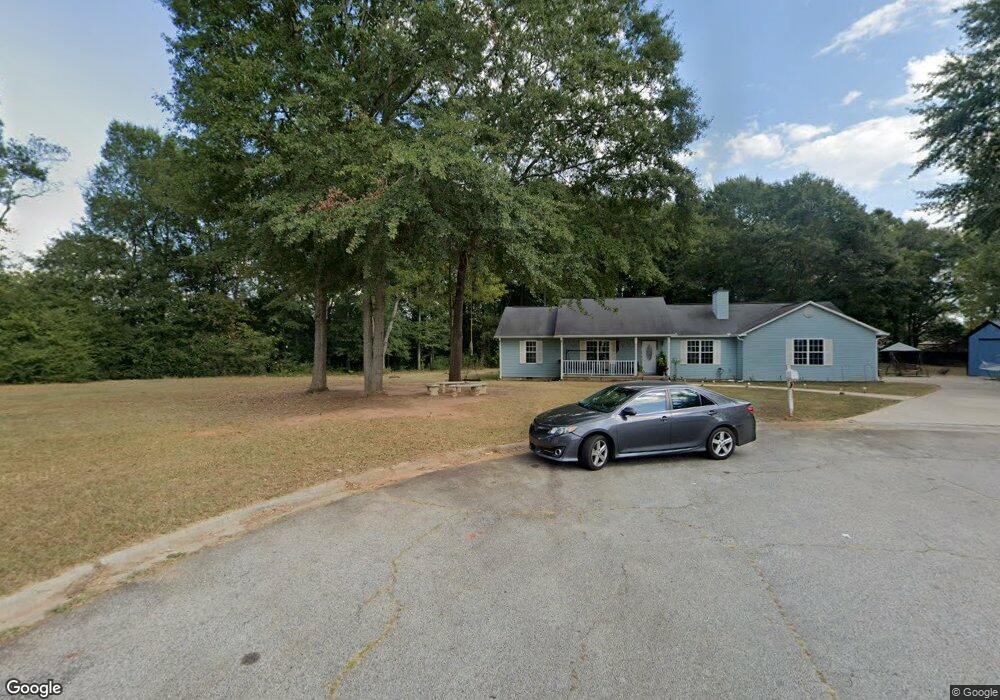
111 Carriage Trace Barnesville, GA 30204
Estimated Value: $261,394 - $325,000
3
Beds
2
Baths
1,686
Sq Ft
$169/Sq Ft
Est. Value
About This Home
This home is located at 111 Carriage Trace, Barnesville, GA 30204 and is currently estimated at $284,099, approximately $168 per square foot. 111 Carriage Trace is a home located in Lamar County with nearby schools including Lamar County Primary School, Lamar County Elementary School, and Lamar County Middle School.
Ownership History
Date
Name
Owned For
Owner Type
Purchase Details
Closed on
Jun 6, 2014
Sold by
Patel Hiran
Bought by
Patel Chirag and Patel Kejaleben
Current Estimated Value
Home Financials for this Owner
Home Financials are based on the most recent Mortgage that was taken out on this home.
Original Mortgage
$36,135
Outstanding Balance
$18,843
Interest Rate
3.75%
Mortgage Type
New Conventional
Estimated Equity
$265,256
Purchase Details
Closed on
May 23, 2013
Sold by
The Bank Of New York Mello
Bought by
Patel Hiren
Purchase Details
Closed on
Mar 5, 2013
Sold by
Smith Travis
Bought by
The Bank Of New York Mellon Tr
Purchase Details
Closed on
Feb 4, 2003
Sold by
Smith Travis
Bought by
Smith Travis
Purchase Details
Closed on
Jul 31, 2001
Sold by
Matthews Glen M
Bought by
Smith Travis
Purchase Details
Closed on
Jul 2, 1997
Sold by
Housing Resources Un
Bought by
Matthews Glen M
Create a Home Valuation Report for This Property
The Home Valuation Report is an in-depth analysis detailing your home's value as well as a comparison with similar homes in the area
Home Values in the Area
Average Home Value in this Area
Purchase History
| Date | Buyer | Sale Price | Title Company |
|---|---|---|---|
| Patel Chirag | $40,150 | -- | |
| Patel Hiren | $52,500 | -- | |
| The Bank Of New York Mellon Tr | $36,000 | -- | |
| Smith Travis | -- | -- | |
| Smith Travis | $118,000 | -- | |
| Matthews Glen M | $115,000 | -- |
Source: Public Records
Mortgage History
| Date | Status | Borrower | Loan Amount |
|---|---|---|---|
| Open | Patel Chirag | $36,135 |
Source: Public Records
Tax History
| Year | Tax Paid | Tax Assessment Tax Assessment Total Assessment is a certain percentage of the fair market value that is determined by local assessors to be the total taxable value of land and additions on the property. | Land | Improvement |
|---|---|---|---|---|
| 2025 | $2,602 | $97,088 | $12,000 | $85,088 |
| 2024 | $2,323 | $81,056 | $12,000 | $69,056 |
| 2023 | $2,236 | $72,424 | $12,000 | $60,424 |
| 2022 | $1,898 | $68,743 | $12,000 | $56,743 |
| 2021 | $1,605 | $53,400 | $9,000 | $44,400 |
| 2020 | $1,508 | $47,628 | $9,000 | $38,628 |
| 2019 | $1,511 | $47,628 | $9,000 | $38,628 |
| 2018 | $1,327 | $43,539 | $9,000 | $34,539 |
| 2017 | $1,320 | $43,539 | $9,000 | $34,539 |
| 2016 | $1,320 | $43,539 | $9,000 | $34,539 |
| 2015 | $486 | $43,539 | $9,000 | $34,539 |
| 2014 | $616 | $44,202 | $9,000 | $35,202 |
| 2013 | -- | $44,201 | $9,000 | $35,201 |
Source: Public Records
Map
Nearby Homes
- 514 Highway 18 W
- 109 Barnesville Ave
- 696 Highway 18 W
- 696 Georgia 18
- 144 U S 341
- 00 U S 341
- 178 Barnesville Ave
- 13 Brown St
- 255 Needleleaf Dr
- 275 Rose Ave
- 121 Westchester Dr
- 149 Akins St
- 270 Cannafax Rd
- 642 Greenwood St
- 531 Thomaston St
- 163 Grove St
- 114 Stafford Ave
- 147 Stafford Ave
- 334 Atlanta St
- 339 Atlanta St
- 111 Carriage Trace Unit 15
- 109 Carriage Trace
- 113 Carriage Trace
- 165 Burnette Rd
- 167 Burnette Rd
- 115 Carriage Trace
- 107 Carriage Trace
- 544 Highway 18 W
- 155 Burnette Rd
- 169 Burnette Rd
- 117 Carriage Trace
- 105 Carriage Trace
- 540 Highway 18 W
- 536 Highway 18 W
- 171 Burnette Rd
- 171 Burnette Rd
- 532 Georgia 18
- 532 Highway 18 W
- 562 Highway 18 W
- 103 Carriage Trace
Your Personal Tour Guide
Ask me questions while you tour the home.