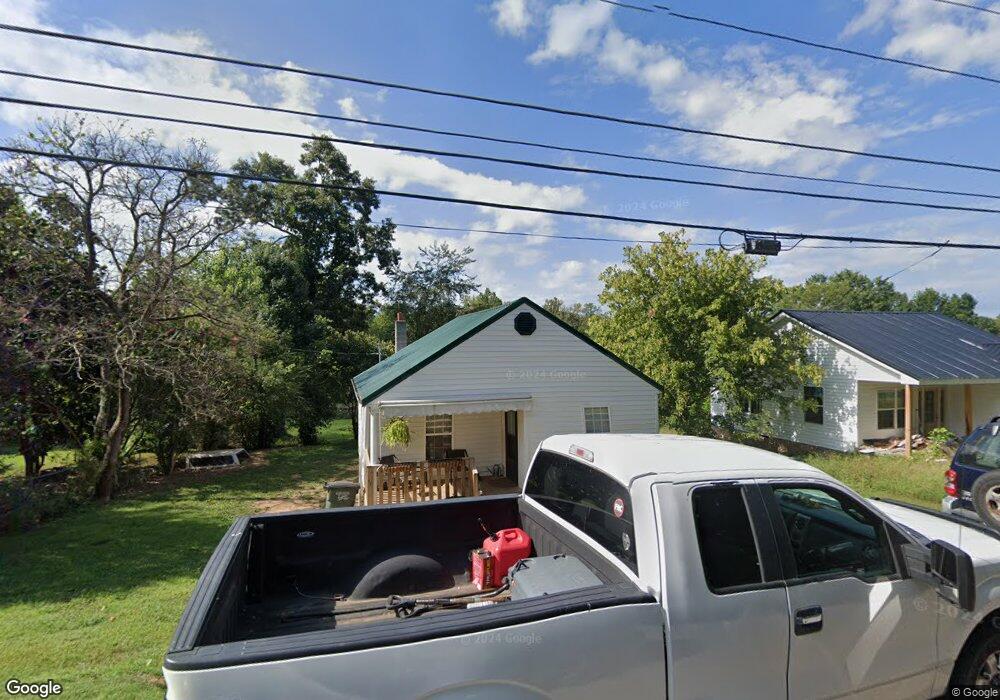
111 Cedar Bend St Sparta, TN 38583
Estimated Value: $71,886 - $174,000
--
Bed
1
Bath
788
Sq Ft
$147/Sq Ft
Est. Value
About This Home
This home is located at 111 Cedar Bend St, Sparta, TN 38583 and is currently estimated at $115,722, approximately $146 per square foot. 111 Cedar Bend St is a home located in White County with nearby schools including Woodland Park Elementary School, White County Middle School, and White County High School.
Ownership History
Date
Name
Owned For
Owner Type
Purchase Details
Closed on
Feb 3, 2022
Sold by
Gardenhire and Kathy
Bought by
Rose James E
Current Estimated Value
Home Financials for this Owner
Home Financials are based on the most recent Mortgage that was taken out on this home.
Original Mortgage
$34,000
Outstanding Balance
$31,411
Interest Rate
3.45%
Mortgage Type
New Conventional
Estimated Equity
$84,311
Purchase Details
Closed on
Jun 24, 1996
Sold by
Milburn Conley
Bought by
Gardenhire and Kathy
Purchase Details
Closed on
Jan 13, 1995
Bought by
Null Bruce L
Purchase Details
Closed on
Apr 26, 1993
Bought by
Eldridge Jeanetta
Purchase Details
Closed on
Feb 19, 1993
Bought by
Eldridge Jeanetta
Purchase Details
Closed on
Feb 5, 1992
Purchase Details
Closed on
Jan 29, 1992
Bought by
Eldridge Jeanetta
Purchase Details
Closed on
Oct 8, 1991
Bought by
Null Bruce L and Null Judy A
Purchase Details
Closed on
Aug 8, 1989
Purchase Details
Closed on
Jan 3, 1900
Create a Home Valuation Report for This Property
The Home Valuation Report is an in-depth analysis detailing your home's value as well as a comparison with similar homes in the area
Home Values in the Area
Average Home Value in this Area
Purchase History
| Date | Buyer | Sale Price | Title Company |
|---|---|---|---|
| Rose James E | $4,000 | Griffin Law Group Pllc | |
| Gardenhire | $18,000 | -- | |
| Null Bruce L | $15,000 | -- | |
| Eldridge Jeanetta | -- | -- | |
| Eldridge Jeanetta | $500 | -- | |
| -- | -- | -- | |
| Eldridge Jeanetta | -- | -- | |
| Null Bruce L | -- | -- | |
| -- | -- | -- | |
| -- | -- | -- |
Source: Public Records
Mortgage History
| Date | Status | Borrower | Loan Amount |
|---|---|---|---|
| Open | Rose James E | $34,000 |
Source: Public Records
Tax History Compared to Growth
Tax History
| Year | Tax Paid | Tax Assessment Tax Assessment Total Assessment is a certain percentage of the fair market value that is determined by local assessors to be the total taxable value of land and additions on the property. | Land | Improvement |
|---|---|---|---|---|
| 2025 | -- | $16,475 | $0 | $0 |
| 2024 | -- | $7,625 | $2,125 | $5,500 |
| 2023 | $226 | $7,625 | $2,125 | $5,500 |
| 2022 | $226 | $7,625 | $2,125 | $5,500 |
| 2021 | $226 | $7,625 | $2,125 | $5,500 |
| 2020 | $226 | $7,625 | $2,125 | $5,500 |
| 2019 | $203 | $6,550 | $2,000 | $4,550 |
| 2018 | $203 | $6,550 | $2,000 | $4,550 |
| 2017 | $203 | $6,550 | $2,000 | $4,550 |
| 2016 | $203 | $6,550 | $2,000 | $4,550 |
| 2015 | $190 | $6,550 | $2,000 | $4,550 |
| 2014 | -- | $6,550 | $2,000 | $4,550 |
| 2013 | -- | $5,875 | $2,000 | $3,875 |
Source: Public Records
Map
Nearby Homes
- 560 Harley's Ridge
- 612 Harleys Ridge
- Lot 3&4 Harbor Green Place
- 18 N Church St
- 0 Knowles St
- 105 N Church St
- 244 W Bockman Way
- 112 N Church St
- 107 N Main St
- 136 N Camp Heights Dr
- 231 S Young St
- 7 Marshall St
- 0 E Bockman Way
- 119 Walker St
- 301 W Everett St
- 316 Gaines St
- Lot 3 & 4 Harbor Green Place
- 00 E Bockman Way
- 319 Mount View Dr
- 319 Mountain View Dr
- 113 Cedar Bend St
- 107 Cedar Bend St
- 114 Cedar Bend St
- 117 Cedar Bend St
- 105 Cedar Bend St
- 106 Cedar Bend St
- 110 Cedar Bend St
- 103 Cedar Bend St
- 118 Cedar Bend St
- 133 S Church St
- 122 Cedar Bend St
- 101 Cedar Bend St
- 129 S Church St
- 125 Cedar Bend St
- 127 S Church St
- 123 S Church St
- 20 Cedar Bend St
- 129 Cedar Bend St
- 1.35 S Church St
- 150 S Church St