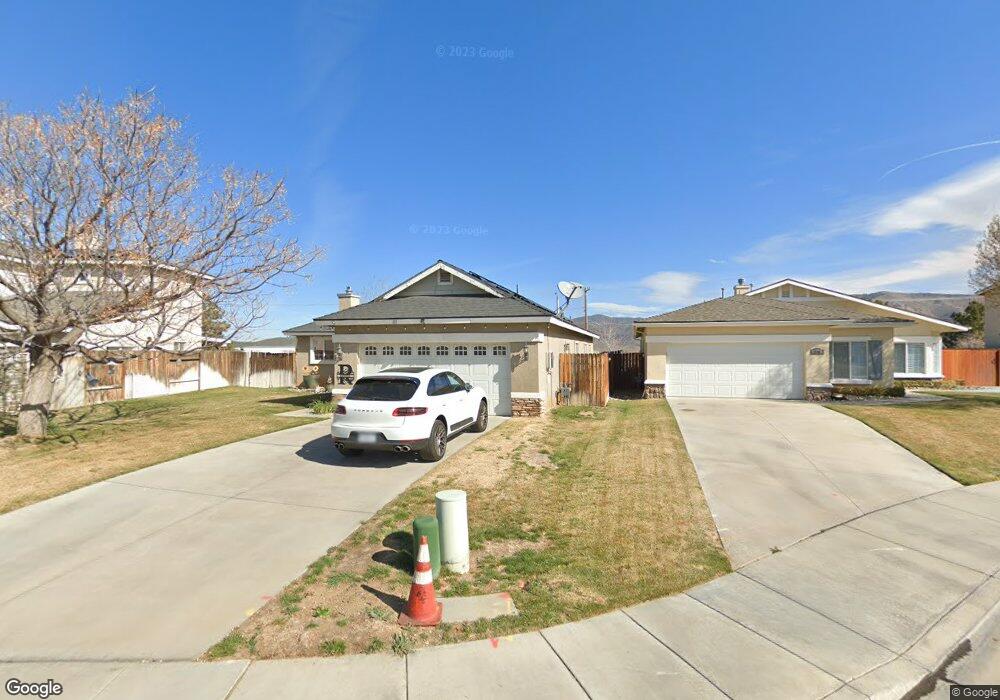
111 Clearview Ct Tehachapi, CA 93561
Estimated Value: $335,000 - $391,000
3
Beds
2
Baths
1,191
Sq Ft
$313/Sq Ft
Est. Value
About This Home
This home is located at 111 Clearview Ct, Tehachapi, CA 93561 and is currently estimated at $373,213, approximately $313 per square foot. 111 Clearview Ct is a home located in Kern County with nearby schools including Tompkins Elementary School, Jacobsen Middle School, and Tehachapi High School.
Ownership History
Date
Name
Owned For
Owner Type
Purchase Details
Closed on
Mar 9, 2020
Sold by
Rijfkogel Herman
Bought by
Rijfkogel Herman and Rijfkogel Madeline Christina
Current Estimated Value
Home Financials for this Owner
Home Financials are based on the most recent Mortgage that was taken out on this home.
Original Mortgage
$116,577
Outstanding Balance
$80,155
Interest Rate
3.2%
Mortgage Type
VA
Estimated Equity
$293,058
Purchase Details
Closed on
Nov 24, 2014
Sold by
Rijfkogel Herman
Bought by
Rijfkogel Herman
Home Financials for this Owner
Home Financials are based on the most recent Mortgage that was taken out on this home.
Original Mortgage
$157,188
Interest Rate
3.89%
Mortgage Type
VA
Purchase Details
Closed on
Sep 9, 2004
Sold by
Pannon Homes 6212 Llc
Bought by
Rijfkogel Herman
Home Financials for this Owner
Home Financials are based on the most recent Mortgage that was taken out on this home.
Original Mortgage
$181,996
Interest Rate
5.79%
Mortgage Type
VA
Create a Home Valuation Report for This Property
The Home Valuation Report is an in-depth analysis detailing your home's value as well as a comparison with similar homes in the area
Home Values in the Area
Average Home Value in this Area
Purchase History
| Date | Buyer | Sale Price | Title Company |
|---|---|---|---|
| Rijfkogel Herman | -- | American Coast Title | |
| Rijfkogel Herman | -- | Stewart Title Guaranty | |
| Rijfkogel Herman | $176,500 | Chicago Title |
Source: Public Records
Mortgage History
| Date | Status | Borrower | Loan Amount |
|---|---|---|---|
| Open | Rijfkogel Herman | $116,577 | |
| Closed | Rijfkogel Herman | $157,188 | |
| Previous Owner | Rijfkogel Herman | $181,996 |
Source: Public Records
Tax History
| Year | Tax Paid | Tax Assessment Tax Assessment Total Assessment is a certain percentage of the fair market value that is determined by local assessors to be the total taxable value of land and additions on the property. | Land | Improvement |
|---|---|---|---|---|
| 2025 | $3,600 | $271,818 | $41,806 | $230,012 |
| 2024 | $3,312 | $266,490 | $40,987 | $225,503 |
| 2023 | $3,312 | $261,267 | $40,184 | $221,083 |
| 2022 | $3,248 | $256,146 | $39,397 | $216,749 |
| 2021 | $3,199 | $251,125 | $38,625 | $212,500 |
| 2020 | $3,206 | $248,551 | $38,229 | $210,322 |
| 2019 | $3,199 | $248,551 | $38,229 | $210,322 |
| 2018 | $3,086 | $238,903 | $36,746 | $202,157 |
| 2017 | $3,072 | $234,000 | $59,000 | $175,000 |
| 2016 | $2,845 | $217,000 | $54,000 | $163,000 |
| 2015 | $2,328 | $179,000 | $45,000 | $134,000 |
| 2014 | $2,066 | $158,000 | $40,000 | $118,000 |
Source: Public Records
Map
Nearby Homes
- 107 Clearview Ct
- 103 Clearview Ct
- 119 Clearview Ct
- 123 Clearview Ct
- 115 Clearview Ct
- 802 S Green St
- 122 Clearview Ct
- 806 S Green St
- 106 Clearview Ct
- 114 Clearview Ct
- 110 Clearview Ct
- 801 Clearview St
- 805 Clearview St
- 814 S Green St
- 809 Clearview St
- 817 Clearview St
- 813 Clearview St
- 119 Brentwood Dr
- 820 S Green St
- 117 Brentwood Dr
Your Personal Tour Guide
Ask me questions while you tour the home.