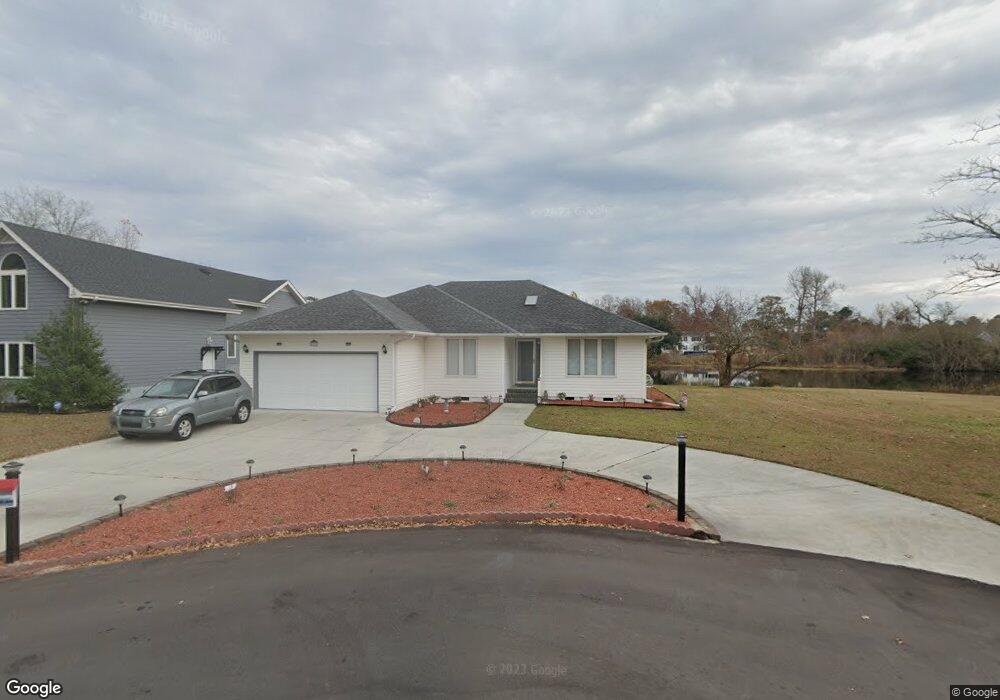
111 Dolphin Cir Hampstead, NC 28443
Estimated Value: $443,019 - $540,000
2
Beds
2
Baths
1,641
Sq Ft
$292/Sq Ft
Est. Value
About This Home
This home is located at 111 Dolphin Cir, Hampstead, NC 28443 and is currently estimated at $478,505, approximately $291 per square foot. 111 Dolphin Cir is a home located in Pender County with nearby schools including Topsail Elementary School, Topsail Middle School, and Topsail High School.
Ownership History
Date
Name
Owned For
Owner Type
Purchase Details
Closed on
Feb 21, 2024
Sold by
Morris Thomas E and Morris Tina Maria
Bought by
Geschickter Brian A and Geschickter Tracy N
Current Estimated Value
Purchase Details
Closed on
Apr 5, 2018
Sold by
Swanno James and Swanno James Francis
Bought by
Swanno Tina M and Morris Thomas
Home Financials for this Owner
Home Financials are based on the most recent Mortgage that was taken out on this home.
Original Mortgage
$150,000
Interest Rate
4.4%
Mortgage Type
New Conventional
Purchase Details
Closed on
Apr 27, 2017
Sold by
Swanno James and Swanno Tina
Bought by
Swanno Tina and Marris Thomas
Purchase Details
Closed on
Feb 13, 2017
Sold by
Morris Thomas E and Swanno Tina Marie F
Bought by
Swanno James
Purchase Details
Closed on
Jul 29, 1998
Bought by
Swanno James
Create a Home Valuation Report for This Property
The Home Valuation Report is an in-depth analysis detailing your home's value as well as a comparison with similar homes in the area
Home Values in the Area
Average Home Value in this Area
Purchase History
| Date | Buyer | Sale Price | Title Company |
|---|---|---|---|
| Geschickter Brian A | $490,000 | None Listed On Document | |
| Swanno Tina M | -- | None Available | |
| Swanno Tina | -- | None Available | |
| Swanno Tina | $2,056 | None Available | |
| Swanno James | -- | None Available | |
| Swanno James | $39,000 | -- |
Source: Public Records
Mortgage History
| Date | Status | Borrower | Loan Amount |
|---|---|---|---|
| Previous Owner | Swanno Tina M | $150,000 |
Source: Public Records
Tax History
| Year | Tax Paid | Tax Assessment Tax Assessment Total Assessment is a certain percentage of the fair market value that is determined by local assessors to be the total taxable value of land and additions on the property. | Land | Improvement |
|---|---|---|---|---|
| 2025 | $1,899 | $407,773 | $160,260 | $247,513 |
| 2024 | $1,899 | $183,661 | $39,766 | $143,895 |
| 2023 | $1,749 | $183,661 | $39,766 | $143,895 |
| 2022 | $1,749 | $183,661 | $39,766 | $143,895 |
| 2021 | $1,749 | $183,661 | $39,766 | $143,895 |
| 2020 | $1,749 | $183,661 | $39,766 | $143,895 |
| 2019 | $791 | $68,545 | $39,766 | $28,779 |
| 2018 | $2,014 | $205,600 | $60,000 | $145,600 |
| 2017 | $2,014 | $205,600 | $60,000 | $145,600 |
| 2016 | $1,883 | $205,600 | $60,000 | $145,600 |
| 2015 | $1,865 | $205,600 | $60,000 | $145,600 |
| 2014 | $1,462 | $205,600 | $60,000 | $145,600 |
| 2013 | -- | $205,600 | $60,000 | $145,600 |
| 2012 | -- | $205,600 | $60,000 | $145,600 |
Source: Public Records
Map
Nearby Homes
- 326 S Belvedere Dr
- 202 Fairway Dr
- 136 S Belvedere Dr
- 227 Hickory
- 412 Lakeview Dr
- 128 S Belvedere Dr
- 203 Hatteras Ct
- 0 Mallard Bay Rd
- 119 Sound View Dr
- 732 Azalea Dr Unit 406
- 778 Avila Dr
- 121 Summerset Landing
- 333 Tall Ships Ln
- 410 Compass Point
- 718 Azalea Dr Unit 460
- 718 Azalea Dr Unit 458
- 100 Yacht Basin Landing
- 113 Mallard Dr
- 505 N Belvedere Dr
- 1017 Mallard Bay Rd
- 109 Dolphin Cir
- 113 Dolphin Cir
- 114 Dolphin Cir
- 107 Dolphin Cir
- Lot 220 Dolphin
- 105 Dolphin Cir
- 108 Dolphin Cir
- 106 Dolphin Cir
- 120 Lakeview Dr
- 103 Dolphin Cir
- 104 Dolphin Cir
- 102 Dolphin Cir
- 114 S Belvedere Dr
- 100 Dolphin Cir
- 224 S Belvedere Dr
- 202 Lakeview Dr
- 300 Lakeview Dr
- 302 Lakeview Dr
- 204 Lake View Dr
- 212 S Belvedere Dr
Your Personal Tour Guide
Ask me questions while you tour the home.