Estimated Value: $331,761
Studio
1
Bath
3,034
Sq Ft
$109/Sq Ft
Est. Value
About This Home
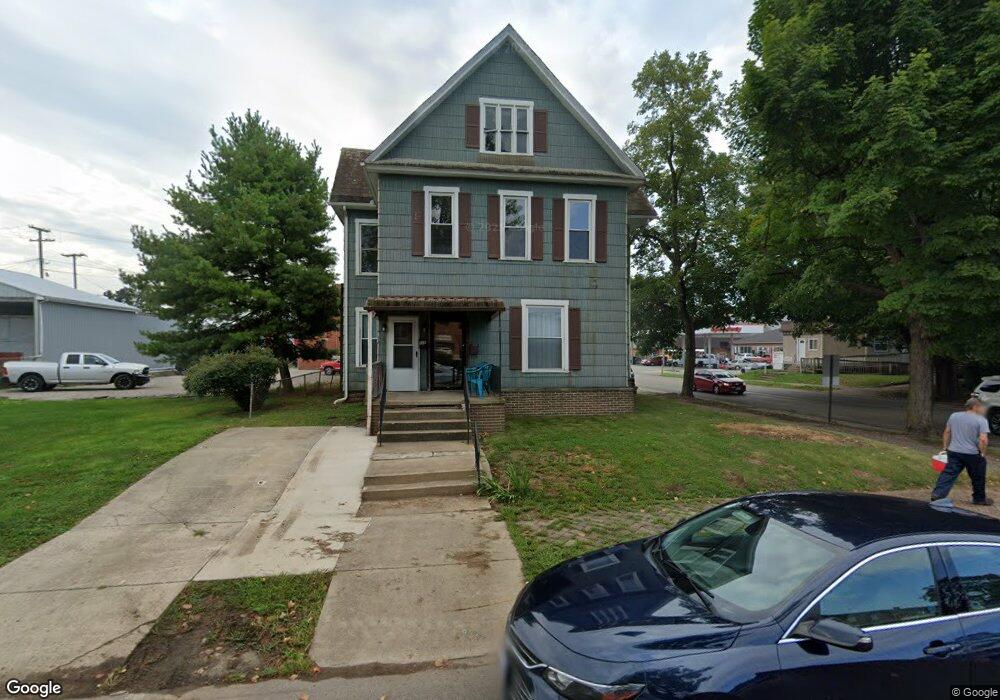
This home is located at 111 E 2nd St, Logan, OH 43138 and is currently estimated at $331,761, approximately $109 per square foot. 111 E 2nd St is a home located in Hocking County with nearby schools including Central Elementary School, St. John the Evangelist School, and Logan Christian School.
Ownership History
Date
Name
Owned For
Owner Type
Purchase Details
Closed on
Dec 30, 2014
Sold by
Wallar Richard M and Wallar Sharon G
Bought by
Rogers Paula K and Rogers James D
Current Estimated Value
Purchase Details
Closed on
Apr 15, 2002
Bought by
Rogers Paula K and James D 11153 W
Create a Home Valuation Report for This Property
The Home Valuation Report is an in-depth analysis detailing your home's value as well as a comparison with similar homes in the area
Home Values in the Area
Average Home Value in this Area
Purchase History
| Date | Buyer | Sale Price | Title Company |
|---|---|---|---|
| Rogers Paula K | $156,000 | None Available | |
| Rogers Paula K | $156,000 | -- |
Source: Public Records
Mortgage History
| Date | Status | Borrower | Loan Amount |
|---|---|---|---|
| Closed | Rogers Paula K | $0 |
Source: Public Records
Tax History
| Year | Tax Paid | Tax Assessment Tax Assessment Total Assessment is a certain percentage of the fair market value that is determined by local assessors to be the total taxable value of land and additions on the property. | Land | Improvement |
|---|---|---|---|---|
| 2024 | $2,169 | $47,260 | $19,570 | $27,690 |
| 2023 | $2,253 | $47,260 | $19,570 | $27,690 |
| 2022 | $2,223 | $47,260 | $19,570 | $27,690 |
| 2021 | $1,299 | $25,610 | $6,520 | $19,090 |
| 2020 | $1,296 | $25,610 | $6,520 | $19,090 |
| 2019 | $1,310 | $25,610 | $6,520 | $19,090 |
| 2018 | $1,280 | $25,610 | $6,520 | $19,090 |
| 2017 | $1,218 | $25,610 | $6,520 | $19,090 |
| 2016 | $1,169 | $25,610 | $6,520 | $19,090 |
| 2015 | $979 | $23,460 | $8,160 | $15,300 |
| 2014 | $979 | $23,460 | $8,160 | $15,300 |
| 2013 | $983 | $23,460 | $8,160 | $15,300 |
Source: Public Records
Map
Nearby Homes
Your Personal Tour Guide
Ask me questions while you tour the home.