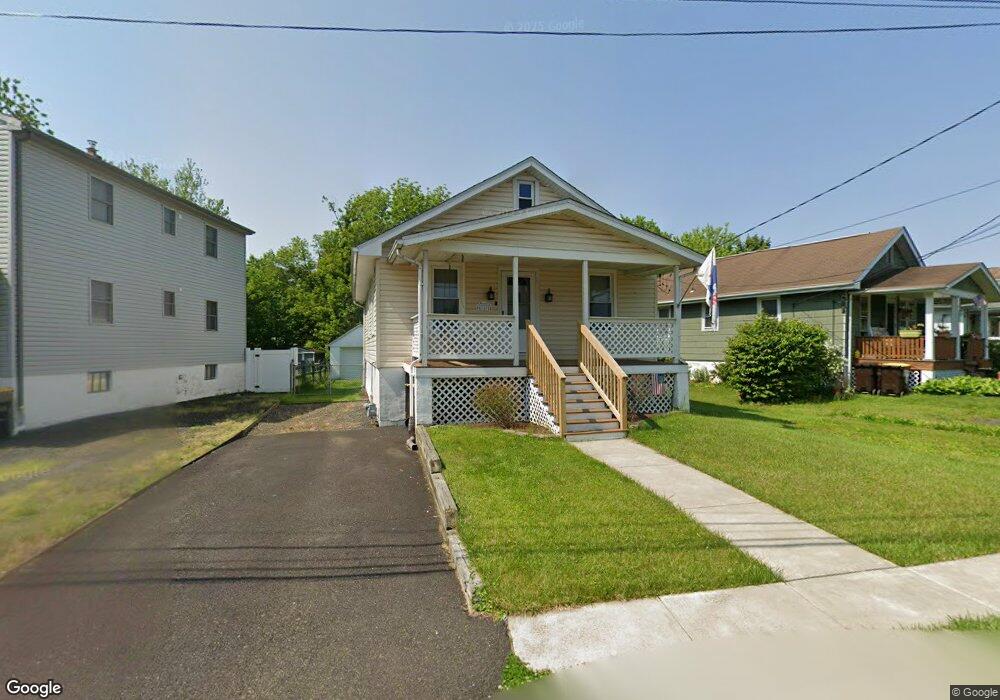
111 Fair Oaks Ave Horsham, PA 19044
Estimated Value: $326,000 - $337,622
2
Beds
2
Baths
816
Sq Ft
$406/Sq Ft
Est. Value
About This Home
This home is located at 111 Fair Oaks Ave, Horsham, PA 19044 and is currently estimated at $330,906, approximately $405 per square foot. 111 Fair Oaks Ave is a home located in Montgomery County with nearby schools including Keith Valley Middle School, Hatboro-Horsham High School, and Queen of Angels Regional Catholic School.
Ownership History
Date
Name
Owned For
Owner Type
Purchase Details
Closed on
Jan 31, 2011
Sold by
Saldan Kathleen E and Saldan Scott
Bought by
Walp Andrew
Current Estimated Value
Home Financials for this Owner
Home Financials are based on the most recent Mortgage that was taken out on this home.
Original Mortgage
$186,400
Outstanding Balance
$128,153
Interest Rate
4.88%
Estimated Equity
$202,753
Purchase Details
Closed on
Mar 23, 2006
Sold by
Mahon Lynn D
Bought by
Saldan Scott and Saldan Kathleen E
Home Financials for this Owner
Home Financials are based on the most recent Mortgage that was taken out on this home.
Original Mortgage
$165,000
Interest Rate
6.4%
Purchase Details
Closed on
Jun 30, 1999
Sold by
Pritchard Tyler T and Pritchard Jill Maria Mroz
Bought by
Mahon Lynn D
Create a Home Valuation Report for This Property
The Home Valuation Report is an in-depth analysis detailing your home's value as well as a comparison with similar homes in the area
Home Values in the Area
Average Home Value in this Area
Purchase History
| Date | Buyer | Sale Price | Title Company |
|---|---|---|---|
| Walp Andrew | $182,500 | None Available | |
| Saldan Scott | $174,000 | Land America | |
| Mahon Lynn D | $105,000 | -- |
Source: Public Records
Mortgage History
| Date | Status | Borrower | Loan Amount |
|---|---|---|---|
| Open | Walp Andrew | $186,400 | |
| Previous Owner | Saldan Scott | $165,000 |
Source: Public Records
Tax History Compared to Growth
Tax History
| Year | Tax Paid | Tax Assessment Tax Assessment Total Assessment is a certain percentage of the fair market value that is determined by local assessors to be the total taxable value of land and additions on the property. | Land | Improvement |
|---|---|---|---|---|
| 2025 | $3,786 | $96,290 | $44,140 | $52,150 |
| 2024 | $3,786 | $96,290 | $44,140 | $52,150 |
| 2023 | $3,603 | $96,290 | $44,140 | $52,150 |
| 2022 | $3,486 | $96,290 | $44,140 | $52,150 |
| 2021 | $3,403 | $96,290 | $44,140 | $52,150 |
| 2020 | $3,323 | $96,290 | $44,140 | $52,150 |
| 2019 | $3,260 | $96,290 | $44,140 | $52,150 |
| 2018 | $2,467 | $96,290 | $44,140 | $52,150 |
| 2017 | $3,114 | $96,290 | $44,140 | $52,150 |
| 2016 | $3,076 | $96,290 | $44,140 | $52,150 |
| 2015 | $2,938 | $96,290 | $44,140 | $52,150 |
| 2014 | $2,938 | $96,290 | $44,140 | $52,150 |
Source: Public Records
Map
Nearby Homes
- 2803 Broadway Ave
- 2625 Horsham Rd
- 2605 Horsham Rd
- 336 Laurel Ave
- 438 Moreboro Rd
- 404 Dresher Rd Unit G
- 258 Garden Ave
- 474 Easton Rd
- 160 Crooked Billet Rd
- 243 Summer Ave
- 603 Orchard Way
- 100 Crooked Billet Rd
- 69 Crooked Billet Rd
- 300 Witmer Rd
- 322 W Moreland Ave
- 43 Black Watch Ct
- 219 W Moreland Ave
- 165 W Moreland Ave
- 45 Flamingo Rd
- 29 Log Pond Dr
- 109 Fair Oaks Ave
- 113 Fair Oaks Ave
- 107 Fair Oaks Ave
- 115 Fair Oaks Ave
- 105 Fair Oaks Ave
- 117 Fair Oaks Ave
- 445 Summit Ave
- 119 Fair Oaks Ave
- 443 Summit Ave
- 441 Summit Ave
- 114 Fair Oaks Ave
- 446 Blair Mill Rd
- 448 Blair Mill Rd
- 439 Summit Ave
- 444 Blair Mill Rd
- 186 Easton Rd
- 456 Blair Mill Rd
- 452 Blair Mill Rd
- 438 Summit Ave
- 176 Easton Rd