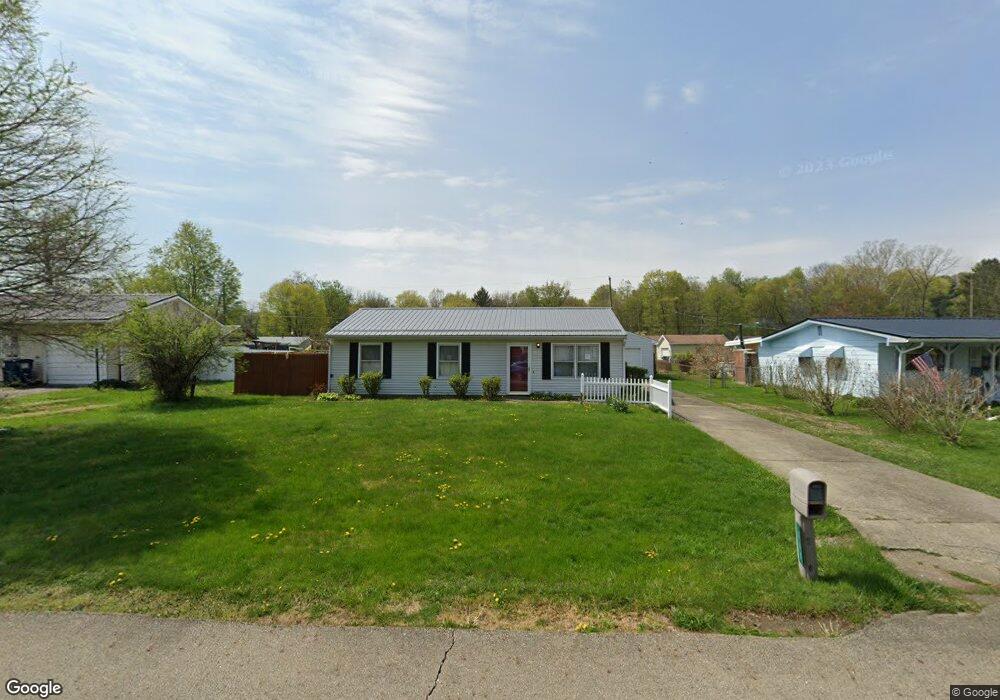
111 Flamingo Dr Newark, OH 43055
Estimated Value: $226,029 - $236,000
3
Beds
1
Bath
1,000
Sq Ft
$231/Sq Ft
Est. Value
About This Home
This home is located at 111 Flamingo Dr, Newark, OH 43055 and is currently estimated at $230,507, approximately $230 per square foot. 111 Flamingo Dr is a home located in Licking County with nearby schools including Utica High School.
Ownership History
Date
Name
Owned For
Owner Type
Purchase Details
Closed on
Aug 11, 2023
Sold by
Mcclung Evelyn R
Bought by
Alumaplus 101 Llc
Current Estimated Value
Home Financials for this Owner
Home Financials are based on the most recent Mortgage that was taken out on this home.
Original Mortgage
$136,500
Outstanding Balance
$133,390
Interest Rate
6.81%
Mortgage Type
New Conventional
Estimated Equity
$97,117
Purchase Details
Closed on
Feb 1, 2006
Sold by
Waldeck Michael L
Bought by
Mcclung Oather and Mcclung Evelyn R
Purchase Details
Closed on
May 11, 2000
Sold by
Miller Larry M
Bought by
Waldeck Michael L
Home Financials for this Owner
Home Financials are based on the most recent Mortgage that was taken out on this home.
Original Mortgage
$81,825
Interest Rate
8.26%
Mortgage Type
FHA
Purchase Details
Closed on
Mar 1, 1995
Sold by
Brown Karen R
Bought by
Miller Larry M and Miller April L
Home Financials for this Owner
Home Financials are based on the most recent Mortgage that was taken out on this home.
Original Mortgage
$64,900
Interest Rate
9.12%
Mortgage Type
New Conventional
Create a Home Valuation Report for This Property
The Home Valuation Report is an in-depth analysis detailing your home's value as well as a comparison with similar homes in the area
Home Values in the Area
Average Home Value in this Area
Purchase History
| Date | Buyer | Sale Price | Title Company |
|---|---|---|---|
| Alumaplus 101 Llc | $210,000 | Chicago Title | |
| Mcclung Oather | $95,000 | Chicago Title | |
| Waldeck Michael L | $82,500 | -- | |
| Miller Larry M | $64,900 | -- |
Source: Public Records
Mortgage History
| Date | Status | Borrower | Loan Amount |
|---|---|---|---|
| Open | Alumaplus 101 Llc | $136,500 | |
| Previous Owner | Waldeck Michael L | $81,825 | |
| Previous Owner | Miller Larry M | $64,900 |
Source: Public Records
Tax History Compared to Growth
Tax History
| Year | Tax Paid | Tax Assessment Tax Assessment Total Assessment is a certain percentage of the fair market value that is determined by local assessors to be the total taxable value of land and additions on the property. | Land | Improvement |
|---|---|---|---|---|
| 2024 | $1,765 | $48,020 | $18,550 | $29,470 |
| 2023 | $1,407 | $48,020 | $18,550 | $29,470 |
| 2022 | $1,161 | $37,450 | $9,450 | $28,000 |
| 2021 | $1,184 | $37,450 | $9,450 | $28,000 |
| 2020 | $1,118 | $37,450 | $9,450 | $28,000 |
| 2019 | $880 | $29,680 | $7,280 | $22,400 |
| 2018 | $884 | $0 | $0 | $0 |
| 2017 | $901 | $0 | $0 | $0 |
| 2016 | $1,026 | $0 | $0 | $0 |
| 2015 | $1,017 | $0 | $0 | $0 |
| 2014 | $1,856 | $0 | $0 | $0 |
| 2013 | $1,006 | $0 | $0 | $0 |
Source: Public Records
Map
Nearby Homes
- 6434 Mount Vernon Rd
- 72 Parkway Dr
- 29 Parkway Dr
- 2360 E Audrey Dr
- Mt Vernon Rd Unit LotWP001
- 65 Sunset Dr
- 152 Lincoln Dr
- 2026 Freehold St
- 2012 Edison St
- 1952 Jamesburg St
- 1968 High Bridge St
- 1993 Iselin St
- 1981 Iselin St
- 1949 Iselin St
- 1957 Iselin St
- 1973 Iselin St
- 1977 Iselin St
- 1989 Iselin St
- 1948 Jamesburg St
- 1954 Iselin St
- 101 Flamingo Dr
- 117 Flamingo Dr
- 176 Parana Dr
- 95 Flamingo Dr
- 129 Flamingo Dr
- 184 Parana Dr
- 170 Parana Dr
- 3188 Cypress Bend Dr
- 192 Parana Dr
- 162 Parana Dr
- 3187 Cypress Bend Dr
- 87 Flamingo Dr
- 141 Flamingo Dr
- 158 Parana Dr
- 118 Flamingo Dr
- 86 Flamingo Dr
- 128 Flamingo Dr
- 81 Flamingo Dr
- 3174 Cypress Bend Dr
- 3159 Cypress Bend Dr