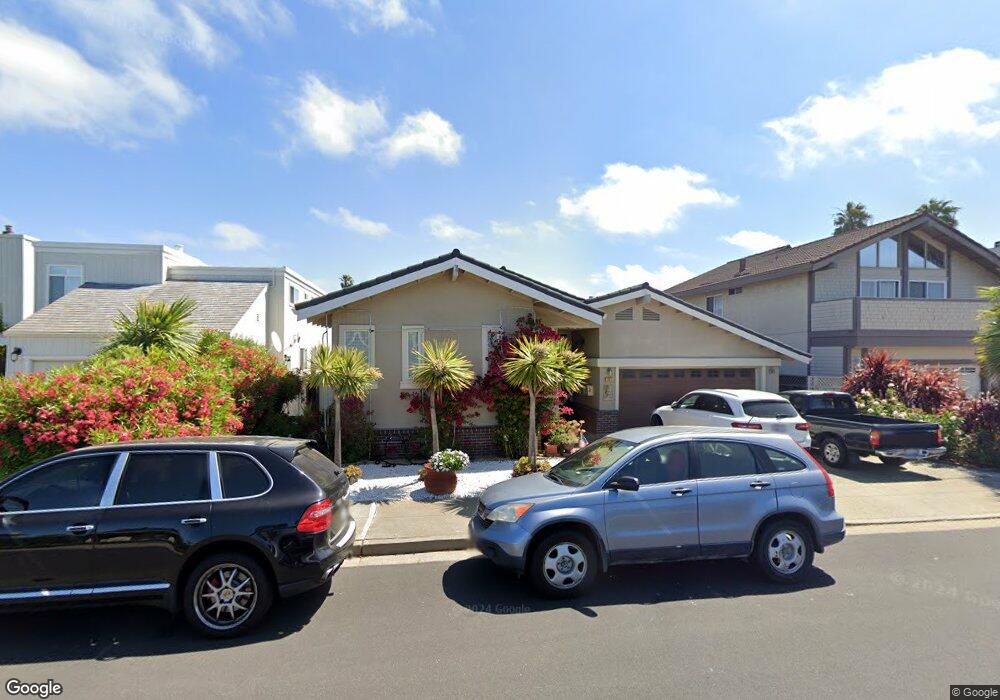
111 Flying Mist Isle Foster City, CA 94404
Treasure Isle NeighborhoodEstimated Value: $2,626,000 - $2,937,000
4
Beds
2
Baths
2,980
Sq Ft
$939/Sq Ft
Est. Value
About This Home
This home is located at 111 Flying Mist Isle, Foster City, CA 94404 and is currently estimated at $2,799,133, approximately $939 per square foot. 111 Flying Mist Isle is a home located in San Mateo County with nearby schools including Brewer Island Elementary School, Bowditch Middle School, and San Mateo High School.
Ownership History
Date
Name
Owned For
Owner Type
Purchase Details
Closed on
May 17, 2021
Sold by
Paleracio Alicia B and The Alicia B Paleracio Living
Bought by
Paleracio Alicia B
Current Estimated Value
Home Financials for this Owner
Home Financials are based on the most recent Mortgage that was taken out on this home.
Original Mortgage
$652,145
Outstanding Balance
$486,070
Interest Rate
3.01%
Mortgage Type
New Conventional
Estimated Equity
$2,313,063
Purchase Details
Closed on
Aug 4, 2006
Sold by
Paleracio Alicia B
Bought by
Paleracio Alicia B
Purchase Details
Closed on
Jan 17, 2001
Sold by
Levy Lawrence & Barbara S Trs
Bought by
Paleracio Alicia B
Home Financials for this Owner
Home Financials are based on the most recent Mortgage that was taken out on this home.
Original Mortgage
$748,000
Interest Rate
9.2%
Purchase Details
Closed on
Nov 14, 1996
Sold by
Lawrence Levy and Lawrence Barbara S
Bought by
Levy Lawrence and Levy Barbara S
Purchase Details
Closed on
Jun 9, 1994
Sold by
Foster Caroline
Bought by
Levy Lawrence and Levy Barbara S
Home Financials for this Owner
Home Financials are based on the most recent Mortgage that was taken out on this home.
Original Mortgage
$356,250
Interest Rate
7.5%
Create a Home Valuation Report for This Property
The Home Valuation Report is an in-depth analysis detailing your home's value as well as a comparison with similar homes in the area
Home Values in the Area
Average Home Value in this Area
Purchase History
| Date | Buyer | Sale Price | Title Company |
|---|---|---|---|
| Paleracio Alicia B | -- | Amrock Inc | |
| Paleracio Alicia B | -- | Amrock Inc | |
| Paleracio Alicia B | -- | None Available | |
| Paleracio Alicia B | $935,000 | North American Title Co | |
| Levy Lawrence | -- | -- | |
| Levy Lawrence | $350,000 | Fidelity National Title Ins |
Source: Public Records
Mortgage History
| Date | Status | Borrower | Loan Amount |
|---|---|---|---|
| Open | Paleracio Alicia B | $652,145 | |
| Closed | Paleracio Alicia B | $748,000 | |
| Previous Owner | Levy Lawrence | $356,250 |
Source: Public Records
Tax History Compared to Growth
Tax History
| Year | Tax Paid | Tax Assessment Tax Assessment Total Assessment is a certain percentage of the fair market value that is determined by local assessors to be the total taxable value of land and additions on the property. | Land | Improvement |
|---|---|---|---|---|
| 2025 | $17,553 | $1,516,055 | $704,441 | $811,614 |
| 2023 | $17,553 | $1,457,188 | $677,088 | $780,100 |
| 2022 | $16,965 | $1,428,617 | $663,812 | $764,805 |
| 2021 | $16,747 | $1,400,607 | $650,797 | $749,810 |
| 2020 | $16,287 | $1,386,246 | $644,124 | $742,122 |
| 2019 | $15,429 | $1,359,067 | $631,495 | $727,572 |
| 2018 | $14,862 | $1,332,420 | $619,113 | $713,307 |
| 2017 | $14,696 | $1,306,296 | $606,974 | $699,322 |
| 2016 | $14,600 | $1,280,684 | $595,073 | $685,611 |
| 2015 | $14,262 | $1,261,449 | $586,135 | $675,314 |
| 2014 | $13,899 | $1,236,741 | $574,654 | $662,087 |
Source: Public Records
Map
Nearby Homes
- 1074 Eagle Ln
- 1336 Marlin Ave
- 1351 Marlin Ave
- 224 Loon Ct
- 650 Pilgrim Dr
- 748 Gull Ave
- 275 Puffin Ct
- 3206 Admiralty Ln
- 1102 Admiralty Ln
- 591 Pilgrim Dr
- 241 Bonita Ln
- 708 Thayer Ln Unit 404
- 769 Eppleton Ln Unit 302
- 1028 Foster Square Ln Unit 305
- 708 Eppleton Ln Unit 204
- 718 Eppleton Ln Unit 303
- 370 Bramble Ct
- 926 Lido Ln
- 1018 Lido Ln
- 1131 Compass Ln Unit 108
- 109 Flying Mist Isle
- 115 Flying Mist Isle
- 121 Flying Mist Isle
- 105 Flying Mist Isle
- 123 Flying Mist Isle
- 108 Flying Mist Isle
- 106 Flying Mist Isle
- 112 Flying Mist Isle
- 100 Flying Mist Isle
- 122 Flying Mist Isle
- 102 Flying Mist Isle
- 127 Flying Mist Isle
- 126 Flying Mist Isle
- 133 Flying Mist Isle
- 753 Lurline Dr
- 761 Lurline Dr
- 241 Shearwater Isle
- 132 Flying Mist Isle
- 237 Shearwater Isle
- 245 Shearwater Isle