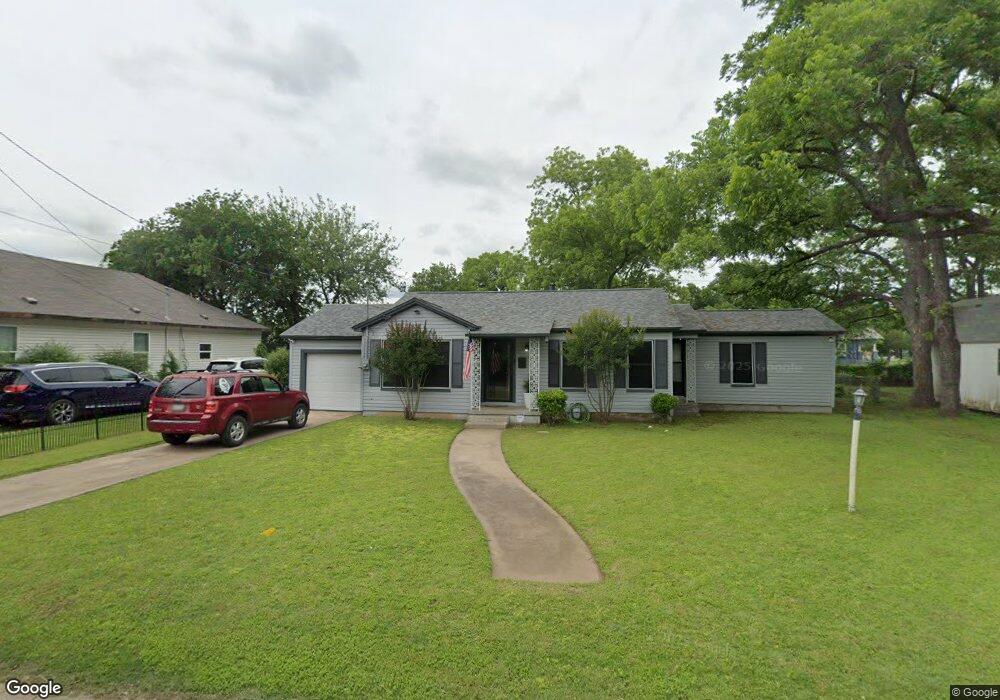
111 Heath St Cleburne, TX 76031
Estimated Value: $162,000 - $181,000
2
Beds
1
Bath
1,168
Sq Ft
$148/Sq Ft
Est. Value
About This Home
This home is located at 111 Heath St, Cleburne, TX 76031 and is currently estimated at $172,862, approximately $147 per square foot. 111 Heath St is a home located in Johnson County with nearby schools including Santa Fe Elementary School, Lowell Smith Jr. Middle School, and Cleburne High School.
Ownership History
Date
Name
Owned For
Owner Type
Purchase Details
Closed on
Dec 22, 2021
Sold by
Rippy Crickman Micah
Bought by
Rippy Wesley Clay and Rippy Becky Laird
Current Estimated Value
Purchase Details
Closed on
Mar 4, 2021
Sold by
Crickman Christopher Shawn
Bought by
Crickman Micah Rippy
Purchase Details
Closed on
Oct 16, 2019
Sold by
Crickman Christopher
Bought by
Crickman Christopher and Crickman Micah
Home Financials for this Owner
Home Financials are based on the most recent Mortgage that was taken out on this home.
Original Mortgage
$66,700
Interest Rate
3.4%
Mortgage Type
New Conventional
Purchase Details
Closed on
Apr 23, 2007
Sold by
Roberts Betty Kay
Bought by
Crickman Christopher
Home Financials for this Owner
Home Financials are based on the most recent Mortgage that was taken out on this home.
Original Mortgage
$74,094
Interest Rate
6.1%
Mortgage Type
Purchase Money Mortgage
Create a Home Valuation Report for This Property
The Home Valuation Report is an in-depth analysis detailing your home's value as well as a comparison with similar homes in the area
Home Values in the Area
Average Home Value in this Area
Purchase History
| Date | Buyer | Sale Price | Title Company |
|---|---|---|---|
| Rippy Wesley Clay | -- | New Title Company Name | |
| Crickman Micah Rippy | -- | None Available | |
| Crickman Christopher | -- | Vylla Title | |
| Crickman Christopher | -- | None Available |
Source: Public Records
Mortgage History
| Date | Status | Borrower | Loan Amount |
|---|---|---|---|
| Previous Owner | Crickman Christopher | $66,700 | |
| Previous Owner | Crickman Christopher | $74,094 |
Source: Public Records
Tax History Compared to Growth
Tax History
| Year | Tax Paid | Tax Assessment Tax Assessment Total Assessment is a certain percentage of the fair market value that is determined by local assessors to be the total taxable value of land and additions on the property. | Land | Improvement |
|---|---|---|---|---|
| 2025 | $2,417 | $108,382 | $23,500 | $84,882 |
| 2024 | $2,417 | $108,382 | $23,500 | $84,882 |
| 2023 | $2,412 | $108,382 | $23,500 | $84,882 |
| 2022 | $2,712 | $108,382 | $23,500 | $84,882 |
| 2021 | $2,073 | $108,382 | $23,500 | $84,882 |
| 2020 | $2,002 | $72,245 | $20,000 | $52,245 |
| 2019 | $1,942 | $72,245 | $20,000 | $52,245 |
| 2018 | $1,766 | $59,757 | $10,000 | $49,757 |
| 2017 | $1,759 | $59,757 | $10,000 | $49,757 |
| 2016 | $1,759 | $59,757 | $10,000 | $49,757 |
| 2015 | $1,615 | $59,757 | $10,000 | $49,757 |
| 2014 | $1,615 | $60,590 | $10,000 | $50,590 |
Source: Public Records
Map
Nearby Homes
- 603 N Anglin St
- 612 N Robinson St
- 614 N Robinson St
- 407 N Wilhite St
- 709 N Wilhite St Unit 711
- 709 N Buffalo Ave
- 735 N Robinson St
- 312 N Wood St
- 507 N Buffalo Ave
- 741 N Robinson St
- 107 Mcarthur Ln
- 702 N Walnut St
- 216 W Willingham St
- 220 W Wardville St
- 1033 Spring Azure Dr
- 5540-5556 County Road 406
- 8225 Farm To Market 1434
- 204 Robbins St
- 922 N Buffalo Ave
- 731 E Brown St
- 109 Heath St
- 109 Heath St Unit 2
- 521 N Anglin St
- 611 N Anglin St
- 611 N Anglin St Unit A-B
- 519 N Anglin St
- 101 E Wilson St
- 522 N Main St
- 606 N Anglin St
- 522 N Anglin St
- 608 N Anglin St
- 608 N Anglin St Unit 3
- 112 Ross St
- 520 N Anglin St
- 615 N Anglin St
- 205 Heath St
- 110 Ross St
- 518 N Anglin St
- 514 N Anglin St Unit B
- 514 N Anglin St Unit C