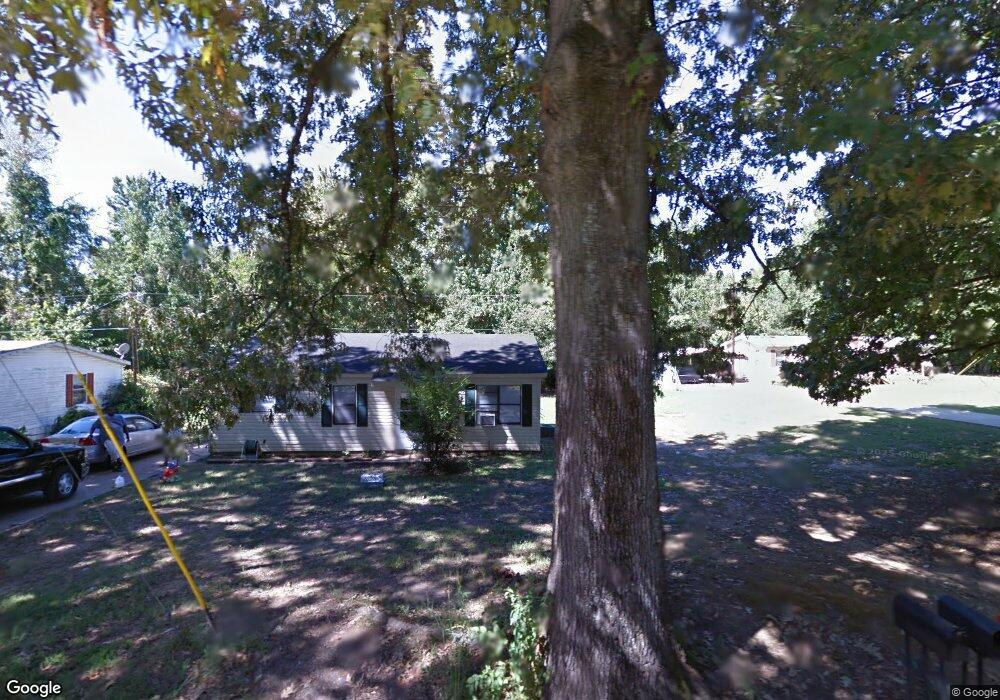
111 Huffman Dr Brighton, TN 38011
Estimated Value: $115,000 - $200,000
--
Bed
--
Bath
936
Sq Ft
$172/Sq Ft
Est. Value
About This Home
This home is located at 111 Huffman Dr, Brighton, TN 38011 and is currently estimated at $160,971, approximately $171 per square foot. 111 Huffman Dr is a home with nearby schools including Brighton Elementary School, Brighton Middle School, and Brighton High School.
Ownership History
Date
Name
Owned For
Owner Type
Purchase Details
Closed on
Aug 28, 2025
Sold by
Dunn Willie E
Bought by
Two Js Enterprises Llc
Current Estimated Value
Home Financials for this Owner
Home Financials are based on the most recent Mortgage that was taken out on this home.
Original Mortgage
$103,000
Outstanding Balance
$103,000
Interest Rate
6.75%
Mortgage Type
Construction
Estimated Equity
$57,971
Purchase Details
Closed on
Nov 16, 2011
Sold by
Patriot Bank
Bought by
Dunn Willie E and Dunn Robin P
Purchase Details
Closed on
Nov 8, 2011
Sold by
Francis
Bought by
Patriot Bank
Purchase Details
Closed on
Sep 7, 2007
Sold by
Hall Talley C
Bought by
Hall Jack S
Home Financials for this Owner
Home Financials are based on the most recent Mortgage that was taken out on this home.
Original Mortgage
$50,018
Interest Rate
6.55%
Purchase Details
Closed on
Aug 29, 1991
Bought by
Hall Jack S and Hall Jean T
Purchase Details
Closed on
Aug 3, 1989
Bought by
Hall Jack S
Purchase Details
Closed on
Jun 16, 1987
Purchase Details
Closed on
May 19, 1978
Bought by
Glass Brenda
Purchase Details
Closed on
Jul 12, 1975
Purchase Details
Closed on
Nov 17, 1956
Create a Home Valuation Report for This Property
The Home Valuation Report is an in-depth analysis detailing your home's value as well as a comparison with similar homes in the area
Home Values in the Area
Average Home Value in this Area
Purchase History
| Date | Buyer | Sale Price | Title Company |
|---|---|---|---|
| Two Js Enterprises Llc | $56,000 | None Listed On Document | |
| Dunn Willie E | $48,300 | -- | |
| Patriot Bank | $48,300 | -- | |
| Hall Jack S | -- | -- | |
| Hall Jack S | -- | -- | |
| Hall Jack S | $1,300 | -- | |
| -- | $1,300 | -- | |
| Glass Brenda | -- | -- | |
| -- | -- | -- | |
| -- | -- | -- |
Source: Public Records
Mortgage History
| Date | Status | Borrower | Loan Amount |
|---|---|---|---|
| Open | Two Js Enterprises Llc | $103,000 | |
| Previous Owner | Not Available | $50,018 |
Source: Public Records
Tax History Compared to Growth
Tax History
| Year | Tax Paid | Tax Assessment Tax Assessment Total Assessment is a certain percentage of the fair market value that is determined by local assessors to be the total taxable value of land and additions on the property. | Land | Improvement |
|---|---|---|---|---|
| 2024 | $0 | $27,400 | $5,075 | $22,325 |
| 2023 | $0 | $27,400 | $5,075 | $22,325 |
| 2022 | $584 | $19,225 | $3,725 | $15,500 |
| 2021 | $584 | $19,225 | $3,725 | $15,500 |
| 2020 | $558 | $19,225 | $3,725 | $15,500 |
| 2019 | $488 | $14,250 | $2,875 | $11,375 |
| 2018 | $488 | $14,250 | $2,875 | $11,375 |
| 2017 | $488 | $14,250 | $2,875 | $11,375 |
| 2016 | $455 | $14,250 | $2,875 | $11,375 |
| 2015 | $455 | $14,250 | $2,875 | $11,375 |
| 2014 | $455 | $14,248 | $0 | $0 |
Source: Public Records
Map
Nearby Homes
- 4417 U S Highway 51
- 67 Oak Ave
- 30 Allen Cir
- 762 Huffman Dr
- 0 Old Highway 51 S
- 117 Hunters Ave
- 330 W Woodlawn Ave
- 161 Shiloh Rd
- 1386 Akins Rd
- 949 Woodlawn Rd
- 0 Lucy Kelly Rd Unit 10207893
- 0 Lucy Kelly Rd Unit 10207887
- 0 Lucy Kelly Rd Unit 23344769
- 0 Lucy Kelly Rd Unit RTC2822436
- 0 Lucy Kelly Rd Unit 10156032
- 1587 Akins Rd
- 000 Mae Sigma Rd
- 65 Candlewood Cove
- 0 Dunlap Orphanage Rd Unit 21216554
- 0 Dunlap Orphanage Rd Unit 10175430