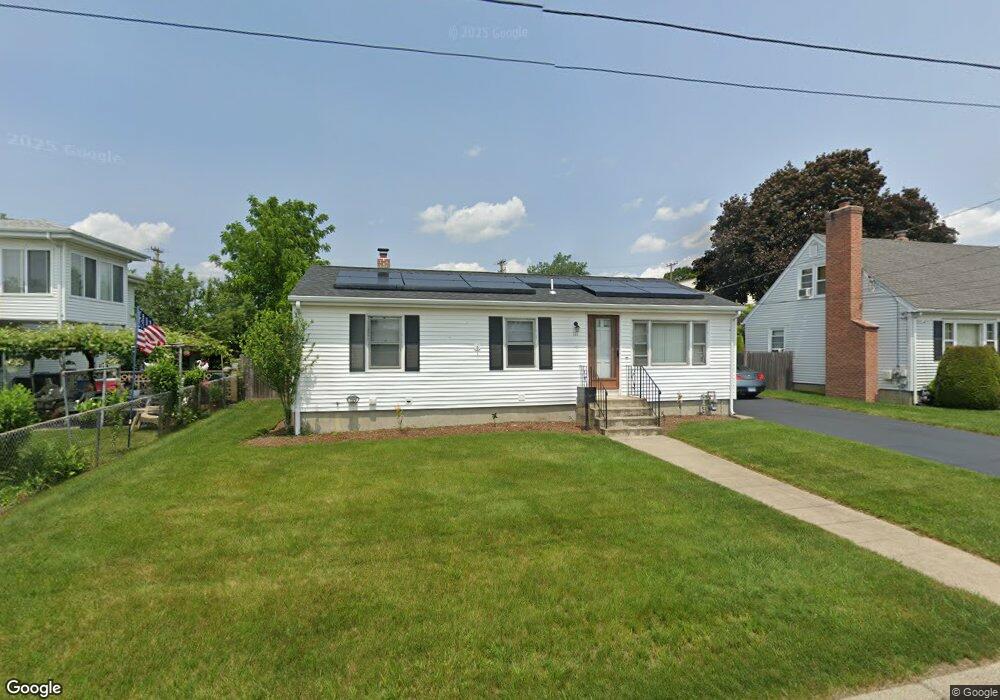
111 Knight St Cranston, RI 02920
Knightsville NeighborhoodEstimated Value: $398,762 - $508,000
3
Beds
1
Bath
1,040
Sq Ft
$415/Sq Ft
Est. Value
About This Home
This home is located at 111 Knight St, Cranston, RI 02920 and is currently estimated at $431,691, approximately $415 per square foot. 111 Knight St is a home located in Providence County with nearby schools including George J. Peters School, Western Hills Middle School, and Cranston High School West.
Ownership History
Date
Name
Owned For
Owner Type
Purchase Details
Closed on
Oct 3, 2024
Sold by
Thibault George V
Bought by
Thibault Beverly L
Current Estimated Value
Purchase Details
Closed on
Sep 5, 1997
Sold by
Cardi Pauline B
Bought by
Thibault Geroge V and Thibault Beverly
Home Financials for this Owner
Home Financials are based on the most recent Mortgage that was taken out on this home.
Original Mortgage
$111,600
Interest Rate
7.36%
Create a Home Valuation Report for This Property
The Home Valuation Report is an in-depth analysis detailing your home's value as well as a comparison with similar homes in the area
Home Values in the Area
Average Home Value in this Area
Purchase History
| Date | Buyer | Sale Price | Title Company |
|---|---|---|---|
| Thibault Beverly L | -- | None Available | |
| Carr Christina | -- | None Available | |
| Thibault Beverly L | -- | None Available | |
| Thibault Geroge V | $112,000 | -- | |
| Thibault Geroge V | $112,000 | -- |
Source: Public Records
Mortgage History
| Date | Status | Borrower | Loan Amount |
|---|---|---|---|
| Previous Owner | Thibault Geroge V | $111,600 |
Source: Public Records
Tax History Compared to Growth
Tax History
| Year | Tax Paid | Tax Assessment Tax Assessment Total Assessment is a certain percentage of the fair market value that is determined by local assessors to be the total taxable value of land and additions on the property. | Land | Improvement |
|---|---|---|---|---|
| 2025 | $4,537 | $326,900 | $109,300 | $217,600 |
| 2024 | $4,449 | $326,900 | $109,300 | $217,600 |
| 2023 | $4,005 | $211,900 | $72,000 | $139,900 |
| 2022 | $3,922 | $211,900 | $72,000 | $139,900 |
| 2021 | $3,814 | $211,900 | $72,000 | $139,900 |
| 2020 | $3,620 | $174,300 | $68,600 | $105,700 |
| 2019 | $3,620 | $174,300 | $68,600 | $105,700 |
| 2018 | $3,537 | $174,300 | $68,600 | $105,700 |
| 2017 | $3,324 | $144,900 | $61,700 | $83,200 |
| 2016 | $3,253 | $144,900 | $61,700 | $83,200 |
| 2015 | $3,253 | $144,900 | $61,700 | $83,200 |
| 2014 | $3,401 | $148,900 | $61,700 | $87,200 |
Source: Public Records
Map
Nearby Homes