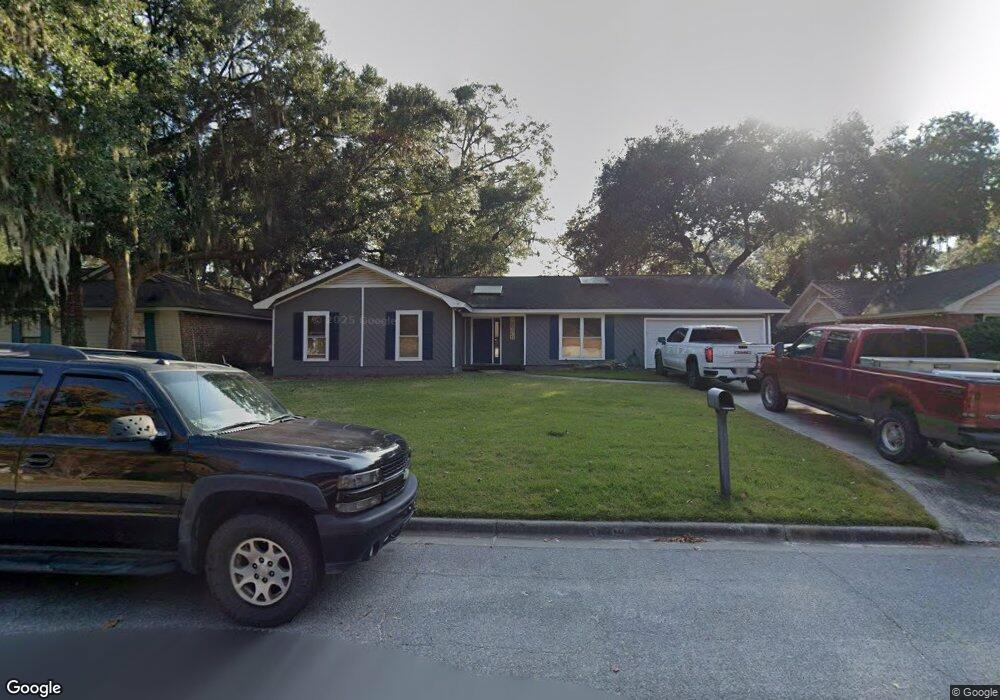
111 Marsh Side Dr Savannah, GA 31410
Estimated Value: $438,863 - $492,000
3
Beds
2
Baths
1,681
Sq Ft
$279/Sq Ft
Est. Value
About This Home
This home is located at 111 Marsh Side Dr, Savannah, GA 31410 and is currently estimated at $469,716, approximately $279 per square foot. 111 Marsh Side Dr is a home located in Chatham County with nearby schools including Marshpoint Elementary School, Coastal Middle School, and Islands High School.
Ownership History
Date
Name
Owned For
Owner Type
Purchase Details
Closed on
Sep 16, 2016
Sold by
Goebel Sherryl N
Bought by
Lee Brandon Jeffrey
Current Estimated Value
Home Financials for this Owner
Home Financials are based on the most recent Mortgage that was taken out on this home.
Original Mortgage
$208,061
Outstanding Balance
$166,564
Interest Rate
3.5%
Mortgage Type
FHA
Estimated Equity
$303,152
Create a Home Valuation Report for This Property
The Home Valuation Report is an in-depth analysis detailing your home's value as well as a comparison with similar homes in the area
Home Values in the Area
Average Home Value in this Area
Purchase History
| Date | Buyer | Sale Price | Title Company |
|---|---|---|---|
| Lee Brandon Jeffrey | $211,900 | -- |
Source: Public Records
Mortgage History
| Date | Status | Borrower | Loan Amount |
|---|---|---|---|
| Open | Lee Brandon Jeffrey | $208,061 |
Source: Public Records
Tax History Compared to Growth
Tax History
| Year | Tax Paid | Tax Assessment Tax Assessment Total Assessment is a certain percentage of the fair market value that is determined by local assessors to be the total taxable value of land and additions on the property. | Land | Improvement |
|---|---|---|---|---|
| 2025 | $2,870 | $138,200 | $38,000 | $100,200 |
| 2024 | $2,870 | $117,120 | $34,000 | $83,120 |
| 2023 | $2,070 | $121,560 | $30,000 | $91,560 |
| 2022 | $2,495 | $102,320 | $26,000 | $76,320 |
| 2021 | $2,586 | $84,240 | $17,600 | $66,640 |
| 2020 | $2,451 | $79,560 | $17,600 | $61,960 |
| 2019 | $2,562 | $74,800 | $17,600 | $57,200 |
| 2018 | $2,548 | $73,800 | $17,600 | $56,200 |
| 2017 | $2,490 | $84,760 | $16,952 | $67,808 |
| 2016 | $2,029 | $73,160 | $15,200 | $57,960 |
| 2015 | $2,047 | $74,000 | $15,200 | $58,800 |
| 2014 | $2,846 | $69,080 | $0 | $0 |
Source: Public Records
Map
Nearby Homes
- 302 Sugar Tree Ct
- 7313 Tropical Way
- 11 River Trace Ct
- 7311 Tropical Way
- 33 River Trace Ct
- 103 Shoals Dr Unit K12
- 100 Oyster Shell Rd Unit A7
- 100 Oyster Shell Rd Unit A-4
- 46 River Oaks Rd
- 115 River Pointe Dr
- 210 Overlook Rd
- 106 Bull River Bluff Dr
- 7010 Johnny Mercer Blvd
- 142 Bull River Bluff Dr
- 101 Coquena Cir E
- 16 Cat Boat Place
- 8001 Us Highway 80 E Unit 401
- 8001 Us Highway 80 E Unit 103
- 302 E Point Dr
- 12 Castaway Place
- 113 Marsh Side Dr
- 109 Marsh Side Dr
- 112 Lazy Lagoon Way
- 114 Lazy Lagoon Way
- 110 Lazy Lagoon Way
- 107 Marsh Side Dr
- 112 Marsh Side Dr
- 116 Lazy Lagoon Way
- 110 Marsh Side Dr
- 108 Lazy Lagoon Way
- 105 Marsh Side Dr
- 114 Marsh Side Dr
- 108 Marsh Side Dr
- 106 Lazy Lagoon Way
- 118 Lazy Lagoon Way
- 106 Marsh Side Dr
- 111 Lazy Lagoon Way
- 113 Lazy Lagoon Way
- 103 Marsh Side Dr
- 109 Lazy Lagoon Way