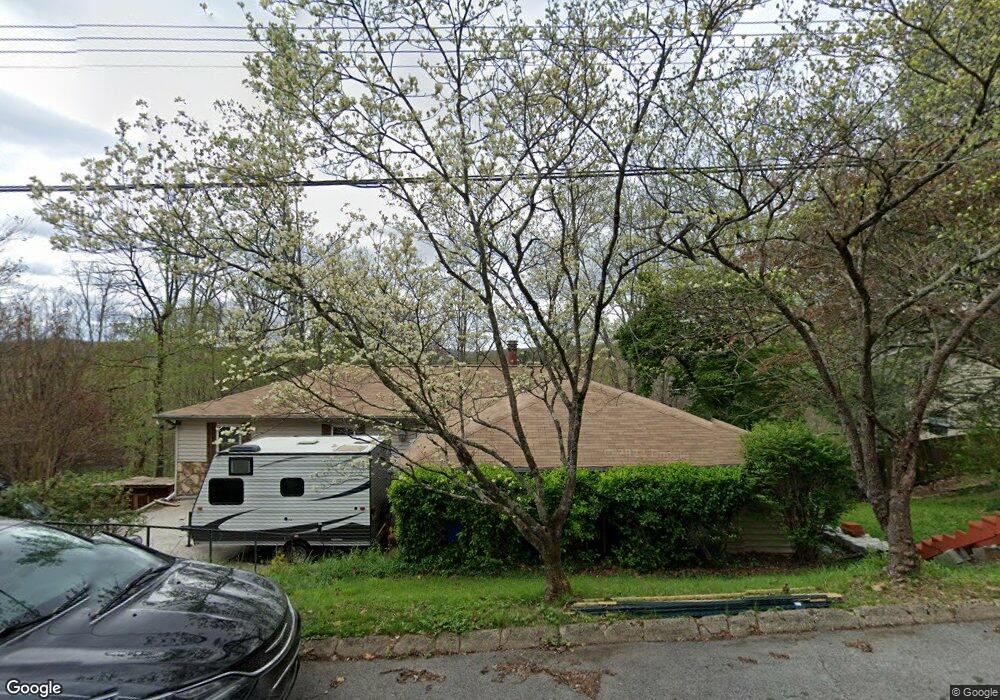
111 Morgan Rd Oak Ridge, TN 37830
Estimated Value: $386,000 - $444,000
4
Beds
2
Baths
3,256
Sq Ft
$128/Sq Ft
Est. Value
About This Home
This home is located at 111 Morgan Rd, Oak Ridge, TN 37830 and is currently estimated at $415,463, approximately $127 per square foot. 111 Morgan Rd is a home located in Anderson County with nearby schools including Linden Elementary, Robertsville Middle School, and Oak Ridge High School.
Ownership History
Date
Name
Owned For
Owner Type
Purchase Details
Closed on
Aug 27, 2020
Sold by
Beste Ariana and Golliher Joshua
Bought by
Moore Arthur J
Current Estimated Value
Home Financials for this Owner
Home Financials are based on the most recent Mortgage that was taken out on this home.
Original Mortgage
$161,750
Outstanding Balance
$143,542
Interest Rate
2.9%
Mortgage Type
New Conventional
Estimated Equity
$271,921
Purchase Details
Closed on
Nov 28, 2007
Sold by
Chadwell William Thomas
Bought by
Beste Ariana
Home Financials for this Owner
Home Financials are based on the most recent Mortgage that was taken out on this home.
Original Mortgage
$145,575
Interest Rate
6.22%
Purchase Details
Closed on
Dec 21, 2004
Sold by
Frolio Nancy
Bought by
Chadwell William T
Home Financials for this Owner
Home Financials are based on the most recent Mortgage that was taken out on this home.
Original Mortgage
$128,304
Interest Rate
5.67%
Create a Home Valuation Report for This Property
The Home Valuation Report is an in-depth analysis detailing your home's value as well as a comparison with similar homes in the area
Home Values in the Area
Average Home Value in this Area
Purchase History
| Date | Buyer | Sale Price | Title Company |
|---|---|---|---|
| Moore Arthur J | $199,900 | Tennessee Title Services Llc | |
| Beste Ariana | $161,750 | -- | |
| Chadwell William T | $142,560 | -- |
Source: Public Records
Mortgage History
| Date | Status | Borrower | Loan Amount |
|---|---|---|---|
| Open | Moore Arthur J | $161,750 | |
| Previous Owner | Chadwell William T | $145,575 | |
| Previous Owner | Chadwell William T | $128,304 |
Source: Public Records
Tax History Compared to Growth
Tax History
| Year | Tax Paid | Tax Assessment Tax Assessment Total Assessment is a certain percentage of the fair market value that is determined by local assessors to be the total taxable value of land and additions on the property. | Land | Improvement |
|---|---|---|---|---|
| 2024 | $1,134 | $46,175 | $7,050 | $39,125 |
| 2023 | $1,134 | $46,175 | $0 | $0 |
| 2022 | $2,202 | $46,175 | $7,050 | $39,125 |
| 2021 | $2,202 | $46,175 | $7,050 | $39,125 |
| 2020 | $1,974 | $46,175 | $7,050 | $39,125 |
| 2019 | $2,020 | $38,450 | $6,875 | $31,575 |
| 2018 | $1,975 | $38,450 | $6,875 | $31,575 |
| 2017 | $1,967 | $38,450 | $6,875 | $31,575 |
| 2016 | $1,967 | $38,450 | $6,875 | $31,575 |
| 2015 | -- | $38,450 | $6,875 | $31,575 |
| 2014 | -- | $38,450 | $6,875 | $31,575 |
| 2013 | -- | $40,575 | $0 | $0 |
Source: Public Records
Map
Nearby Homes
- 657 Robertsville Rd
- 558560 W Outer Dr
- 650 Robertsville Rd
- 899 W Outer Dr
- 206 Bunker Ln
- 845 W Outer Dr
- 104 Sanford Ln
- 119 Briar Rd
- 212 Byron Ln
- 108 Lewis Ln
- 26 Lindale Ln
- 128 Sheridan Cir
- 461 Robertsville Rd
- 111 Old Evacuation Ln
- 110 Pine Ln
- 106 Wood Ridge Ln
- 2210 Oak Ridge Turnpike
- 442 Robertsville Rd
- 109 Mockingbird Ln
- 105 W Melbourne Rd
- 113 Morgan Rd
- 109 Morgan Rd
- 108 Morgan Rd
- 110 Morgan Rd
- 115 Morgan Rd
- 107 Morgan Rd
- 119 E Morningside Dr
- 18 Monaco Ln
- 115 E Morningside Dr
- 104 Morgan Rd
- 113 E Morningside Dr
- Lot 555d Morningside Dr
- 14 Monaco Ln
- 121 Morningside Dr
- 102 Morgan Rd
- 122 E Morningside Dr
- 111 E Morningside Dr
- 20 Monaco Ln
- 124 E Morningside Dr
- 103 Morgan Rd