Estimated Value: $72,000 - $105,000
2
Beds
1
Bath
1,404
Sq Ft
$61/Sq Ft
Est. Value
About This Home
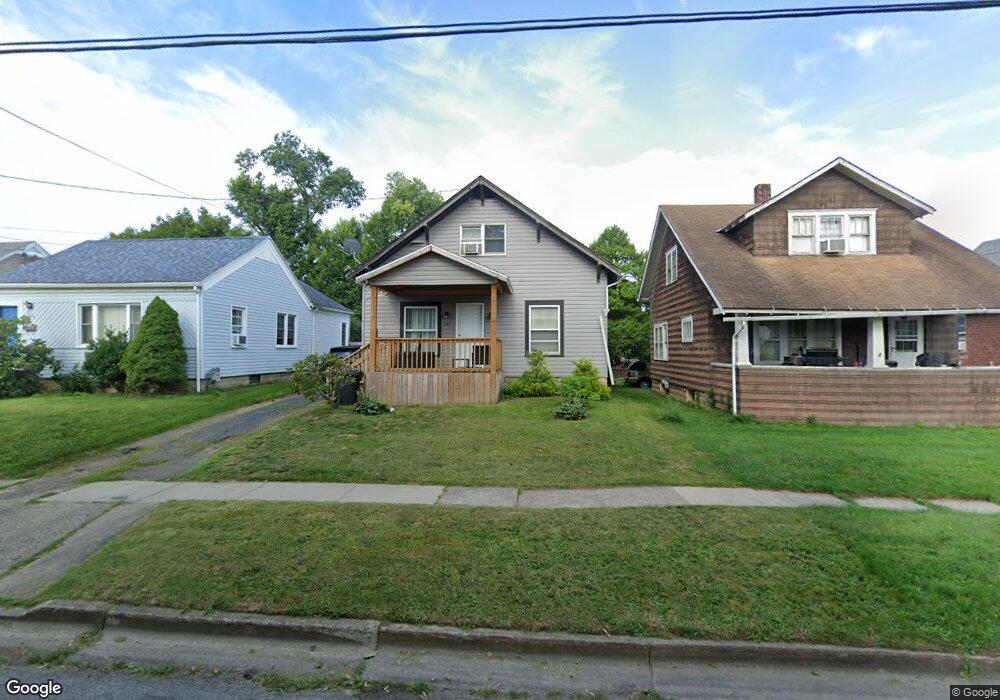
This home is located at 111 N 18th St, Olean, NY 14760 and is currently estimated at $85,668, approximately $61 per square foot. 111 N 18th St is a home located in Cattaraugus County with nearby schools including Olean Intermediate-Middle School, Olean Senior High School, and Southern Tier Catholic School.
Ownership History
Date
Name
Owned For
Owner Type
Purchase Details
Closed on
Mar 20, 2025
Sold by
Gonska Daniel J
Bought by
Putt Shaine D and Putt Kaitlyn C
Current Estimated Value
Home Financials for this Owner
Home Financials are based on the most recent Mortgage that was taken out on this home.
Original Mortgage
$59,400
Outstanding Balance
$59,097
Interest Rate
6.89%
Mortgage Type
Purchase Money Mortgage
Estimated Equity
$26,571
Purchase Details
Closed on
Feb 7, 2003
Sold by
Estate Of Cummings Genevieve M
Bought by
Gonska Daniel J
Create a Home Valuation Report for This Property
The Home Valuation Report is an in-depth analysis detailing your home's value as well as a comparison with similar homes in the area
Home Values in the Area
Average Home Value in this Area
Purchase History
| Date | Buyer | Sale Price | Title Company |
|---|---|---|---|
| Putt Shaine D | $63,000 | None Available | |
| Gonska Daniel J | $54,275 | Nicholas A Jr Dicerbo | |
| Gonska Daniel J | $54,275 | Nicholas A Jr Dicerbo |
Source: Public Records
Mortgage History
| Date | Status | Borrower | Loan Amount |
|---|---|---|---|
| Open | Putt Shaine D | $59,400 |
Source: Public Records
Tax History
| Year | Tax Paid | Tax Assessment Tax Assessment Total Assessment is a certain percentage of the fair market value that is determined by local assessors to be the total taxable value of land and additions on the property. | Land | Improvement |
|---|---|---|---|---|
| 2024 | $3,667 | $58,000 | $4,500 | $53,500 |
| 2023 | $2,184 | $58,000 | $4,500 | $53,500 |
| 2022 | $2,215 | $58,000 | $4,500 | $53,500 |
| 2021 | $2,279 | $58,000 | $4,500 | $53,500 |
| 2020 | $1,654 | $58,000 | $4,500 | $53,500 |
| 2019 | $871 | $58,000 | $4,500 | $53,500 |
| 2018 | $2,487 | $58,000 | $4,500 | $53,500 |
| 2017 | $1,675 | $58,000 | $4,500 | $53,500 |
| 2016 | $1,631 | $58,000 | $4,500 | $53,500 |
| 2015 | -- | $58,000 | $4,500 | $53,500 |
| 2014 | -- | $58,000 | $4,500 | $53,500 |
Source: Public Records
Map
Nearby Homes
- 108 S 18th St
- 111 S 18th St
- 113 S 18th St
- 1705 W State St
- 114 S 17th St
- 121 S 17th St
- 132 N 15th St
- 224 S 16th St
- 216 N 14th St
- 204 N 24th St
- 207 N 11th St
- 129 S 11th St
- 915 Washington St
- 1013 W Sullivan St
- 128 S 8th St
- 3019 Nys Route 417
- 118 S 7th St
- 3031 Nys Route 417
- 3033 W State St
- 705 Irving St
Your Personal Tour Guide
Ask me questions while you tour the home.