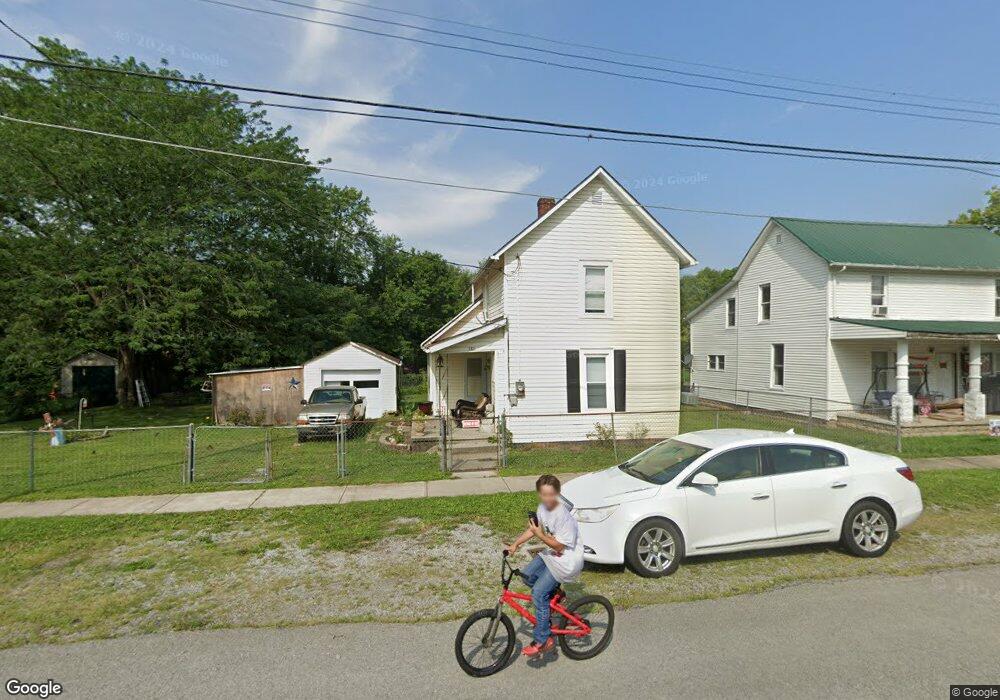
111 N High St Midland, OH 45148
Estimated Value: $88,428 - $147,000
2
Beds
1
Bath
1,040
Sq Ft
$108/Sq Ft
Est. Value
About This Home
This home is located at 111 N High St, Midland, OH 45148 and is currently estimated at $112,607, approximately $108 per square foot. 111 N High St is a home located in Clinton County with nearby schools including Putman Elementary School, Blanchester Middle School, and Blanchester Intermediate School.
Ownership History
Date
Name
Owned For
Owner Type
Purchase Details
Closed on
Mar 27, 2023
Sold by
Wagner Vivian Jeanette
Bought by
Lamb Randal and Lamb Pamela
Current Estimated Value
Purchase Details
Closed on
Jan 16, 2007
Sold by
Frost James L and Frost Jeffrey
Bought by
Boomer Shannon
Purchase Details
Closed on
Jul 21, 2006
Sold by
Frost James L
Bought by
Frost James L and Frost Jeffrey
Purchase Details
Closed on
Jul 7, 1998
Sold by
Frost James L
Bought by
Frost James L
Purchase Details
Closed on
Feb 9, 1998
Bought by
Hixson Lillian M
Create a Home Valuation Report for This Property
The Home Valuation Report is an in-depth analysis detailing your home's value as well as a comparison with similar homes in the area
Home Values in the Area
Average Home Value in this Area
Purchase History
| Date | Buyer | Sale Price | Title Company |
|---|---|---|---|
| Lamb Randal | $500 | None Listed On Document | |
| Boomer Shannon | $68,833 | -- | |
| Frost James L | -- | -- | |
| Frost James L | $14,100 | -- | |
| Hixson Lillian M | -- | -- |
Source: Public Records
Tax History Compared to Growth
Tax History
| Year | Tax Paid | Tax Assessment Tax Assessment Total Assessment is a certain percentage of the fair market value that is determined by local assessors to be the total taxable value of land and additions on the property. | Land | Improvement |
|---|---|---|---|---|
| 2024 | $660 | $17,920 | $2,100 | $15,820 |
| 2023 | $660 | $17,920 | $2,100 | $15,820 |
| 2022 | $629 | $15,270 | $1,330 | $13,940 |
| 2021 | $661 | $15,270 | $1,330 | $13,940 |
| 2020 | $642 | $15,270 | $1,330 | $13,940 |
| 2019 | $621 | $14,000 | $1,330 | $12,670 |
| 2018 | $623 | $14,000 | $1,330 | $12,670 |
| 2017 | $305 | $14,000 | $1,330 | $12,670 |
| 2016 | $619 | $14,360 | $1,370 | $12,990 |
| 2015 | $619 | $14,360 | $1,370 | $12,990 |
| 2013 | $637 | $14,360 | $1,370 | $12,990 |
Source: Public Records
Map
Nearby Homes
- 147 Broadway St S
- 187 Mitchell Ave
- 1192 Frazier Rd
- 1339 Hales Branch Rd
- 1295 Hales Branch Rd
- 13593 U S 68
- 945 Lazenby Rd
- 1 Dudley Rd
- 14456 U S 68
- 2211 Reeder Rd
- 1896 Reeder Rd
- 1623 Reeder Rd
- C Cherry St
- 1211 Pratt Rd
- 963 Pratt Rd
- 3991 Westboro Rd
- 510 Cherry St
- 508 Cherry St
- D Cherry St
- 506 Cherry St