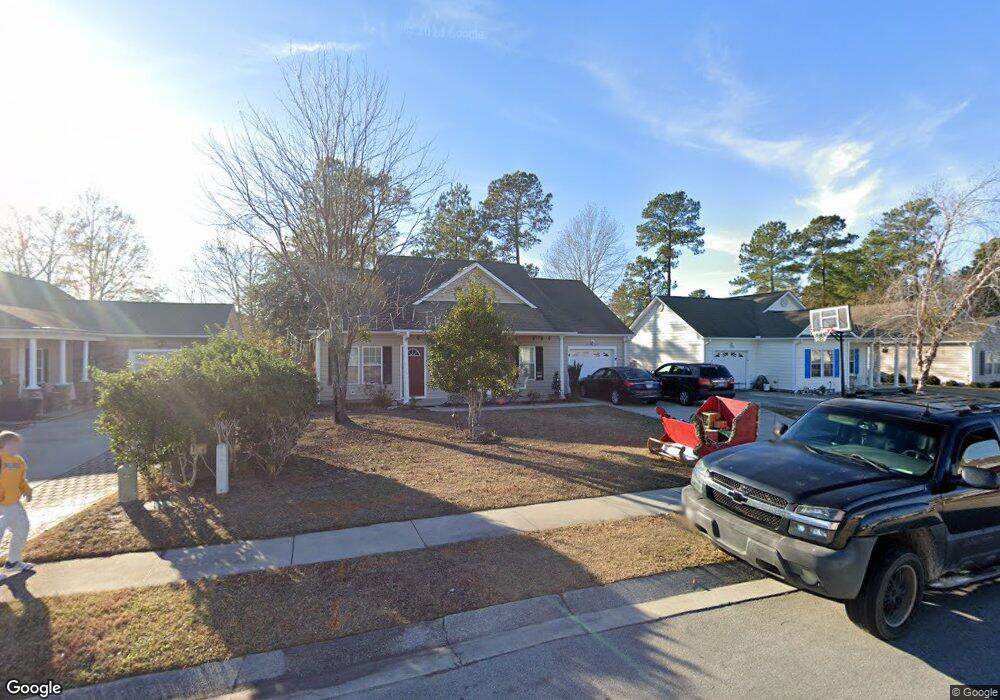
111 N Palm Dr Winnabow, NC 28479
Estimated Value: $295,909 - $330,000
2
Beds
2
Baths
1,336
Sq Ft
$231/Sq Ft
Est. Value
About This Home
This home is located at 111 N Palm Dr, Winnabow, NC 28479 and is currently estimated at $308,977, approximately $231 per square foot. 111 N Palm Dr is a home located in Brunswick County with nearby schools including Belville Elementary School, Leland Middle School, and North Brunswick High School.
Ownership History
Date
Name
Owned For
Owner Type
Purchase Details
Closed on
Apr 29, 2016
Sold by
Shackelford West Nancy Kay and West Joshua A
Bought by
Shackelford West Nancy Kay and West Joshua A
Current Estimated Value
Home Financials for this Owner
Home Financials are based on the most recent Mortgage that was taken out on this home.
Original Mortgage
$124,350
Outstanding Balance
$99,152
Interest Rate
3.71%
Mortgage Type
New Conventional
Estimated Equity
$209,825
Purchase Details
Closed on
Mar 14, 2013
Sold by
Lindsay Christopher Monette
Bought by
Shackelford Lindsay Nancy Kay and Shackelford Nancy K
Purchase Details
Closed on
Nov 28, 2006
Sold by
Tft & Co Inc
Bought by
Shackelford Nancy K
Home Financials for this Owner
Home Financials are based on the most recent Mortgage that was taken out on this home.
Original Mortgage
$149,200
Interest Rate
6.33%
Mortgage Type
New Conventional
Create a Home Valuation Report for This Property
The Home Valuation Report is an in-depth analysis detailing your home's value as well as a comparison with similar homes in the area
Home Values in the Area
Average Home Value in this Area
Purchase History
| Date | Buyer | Sale Price | Title Company |
|---|---|---|---|
| Shackelford West Nancy Kay | -- | Servicelink | |
| Shackelford Lindsay Nancy Kay | -- | None Available | |
| Shackelford Nancy K | $187,000 | None Available |
Source: Public Records
Mortgage History
| Date | Status | Borrower | Loan Amount |
|---|---|---|---|
| Open | Shackelford West Nancy Kay | $124,350 | |
| Closed | Shackelford Nancy K | $149,200 |
Source: Public Records
Tax History Compared to Growth
Tax History
| Year | Tax Paid | Tax Assessment Tax Assessment Total Assessment is a certain percentage of the fair market value that is determined by local assessors to be the total taxable value of land and additions on the property. | Land | Improvement |
|---|---|---|---|---|
| 2025 | $1,673 | $240,620 | $70,000 | $170,620 |
| 2024 | $1,673 | $240,620 | $70,000 | $170,620 |
| 2023 | $1,393 | $240,620 | $70,000 | $170,620 |
| 2022 | $1,393 | $167,050 | $40,000 | $127,050 |
| 2021 | $1,393 | $167,050 | $40,000 | $127,050 |
| 2020 | $1,326 | $167,050 | $40,000 | $127,050 |
| 2019 | $1,311 | $42,560 | $40,000 | $2,560 |
| 2018 | $1,100 | $28,060 | $25,000 | $3,060 |
| 2017 | $1,100 | $28,060 | $25,000 | $3,060 |
| 2016 | $1,037 | $28,060 | $25,000 | $3,060 |
| 2015 | $993 | $140,260 | $25,000 | $115,260 |
| 2014 | $935 | $140,551 | $25,000 | $115,551 |
Source: Public Records
Map
Nearby Homes
- 136 N Palm Dr
- 134 Jansen Ln
- Cypress Plan at Mallory Creek - Townhomes at Mallory Creek
- 130 Jansen Ln
- 2197 N Palm Dr
- 222 Bimini Dr
- 106 Kellerton Ct
- 187 Emberwood Dr
- 199 Tylers Cove Way
- 115 Cove Landing
- 123 Cove Landing
- 1187 S Brook Rd
- 195 N Palm Dr
- 368 St Kitts Way
- 376 St Kitts Way
- 207 N Palm Dr
- 3330 Hemlock Way Unit Lot 128
- 3378 Hemlock Way
- 511 Heartwood Dr
- 3057 Smeades Dr