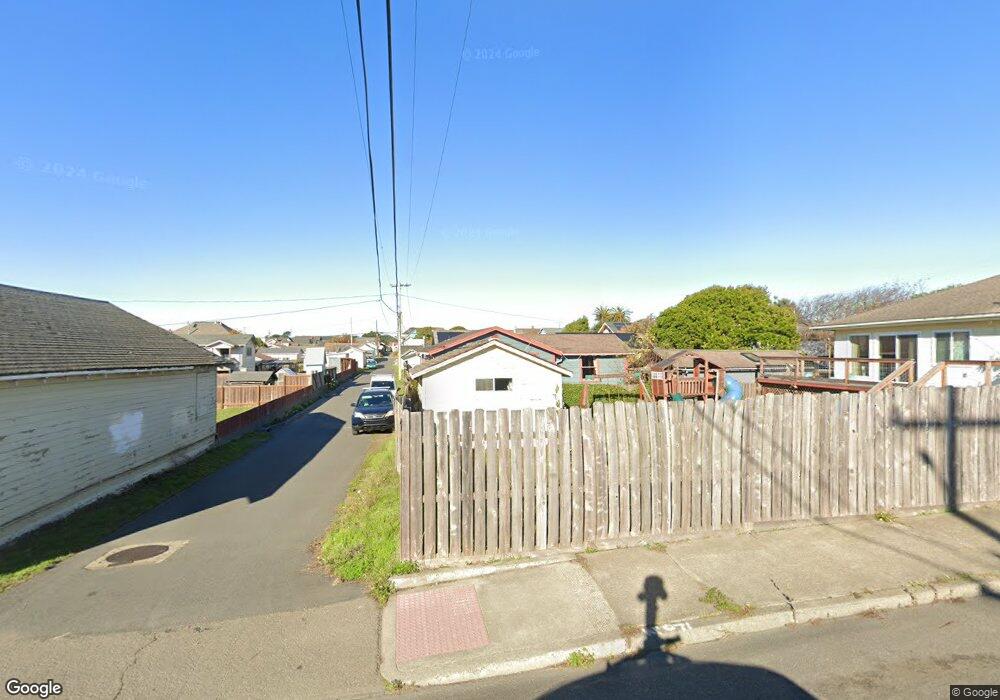
111 N Whipple St Fort Bragg, CA 95437
Estimated Value: $398,000 - $503,000
1
Bed
1
Bath
--
Sq Ft
7,405
Sq Ft Lot
About This Home
This home is located at 111 N Whipple St, Fort Bragg, CA 95437 and is currently estimated at $454,330. 111 N Whipple St is a home located in Mendocino County with nearby schools including Fort Bragg High School and Three Rivers Charter School.
Ownership History
Date
Name
Owned For
Owner Type
Purchase Details
Closed on
Feb 11, 2020
Sold by
Global Capital Concepts Inc
Bought by
Godeke Jason and Mathews Cristina
Current Estimated Value
Purchase Details
Closed on
Dec 4, 2019
Sold by
Global Capital Concepts Inc
Bought by
Godeke Jason and Mathews Cristina
Purchase Details
Closed on
May 21, 2012
Sold by
Klugherz Garrett E and Klugherz Roxanne M
Bought by
Global Capital Concepts Inc
Purchase Details
Closed on
Oct 6, 2011
Sold by
Abramson Keevan and Abramson Joanne Marie
Bought by
Abramson Keevan and Abramson Joanne Marie
Purchase Details
Closed on
Dec 3, 2003
Sold by
Klugherz Garrett E and Klugherz Roxanne M
Bought by
Fiedler Jesse O and Fiedler Melissa Newkirk
Home Financials for this Owner
Home Financials are based on the most recent Mortgage that was taken out on this home.
Original Mortgage
$168,621
Interest Rate
6.04%
Mortgage Type
Seller Take Back
Create a Home Valuation Report for This Property
The Home Valuation Report is an in-depth analysis detailing your home's value as well as a comparison with similar homes in the area
Home Values in the Area
Average Home Value in this Area
Purchase History
| Date | Buyer | Sale Price | Title Company |
|---|---|---|---|
| Godeke Jason | $280,000 | Chicago Title | |
| Godeke Jason | $280,000 | Chicago Title | |
| Global Capital Concepts Inc | $91,200 | None Available | |
| Abramson Keevan | -- | None Available | |
| Fiedler Jesse O | -- | First American Title Co |
Source: Public Records
Mortgage History
| Date | Status | Borrower | Loan Amount |
|---|---|---|---|
| Previous Owner | Fiedler Jesse O | $168,621 |
Source: Public Records
Tax History Compared to Growth
Tax History
| Year | Tax Paid | Tax Assessment Tax Assessment Total Assessment is a certain percentage of the fair market value that is determined by local assessors to be the total taxable value of land and additions on the property. | Land | Improvement |
|---|---|---|---|---|
| 2025 | $3,603 | $306,218 | $153,109 | $153,109 |
| 2023 | $3,603 | $294,328 | $147,164 | $147,164 |
| 2022 | $3,585 | $288,558 | $144,279 | $144,279 |
| 2021 | $3,383 | $282,900 | $141,450 | $141,450 |
| 2020 | $2,102 | $172,271 | $126,332 | $45,939 |
| 2019 | $2,076 | $168,894 | $123,856 | $45,038 |
| 2018 | $2,050 | $165,584 | $121,428 | $44,156 |
| 2017 | $1,861 | $162,338 | $119,048 | $43,290 |
| 2016 | $1,825 | $159,154 | $116,713 | $42,441 |
| 2015 | $1,797 | $156,765 | $114,961 | $41,804 |
| 2014 | $1,750 | $153,694 | $112,709 | $40,985 |
Source: Public Records
Map
Nearby Homes
- 142 S Franklin St
- 251 S Franklin St
- 459 S Mcpherson St
- 494 S Whipple St
- 423 N Franklin St
- 119 E Pine St
- 575 S Whipple St
- 517 S Lincoln St
- 571 S Franklin St
- 215 S Sanderson Way
- 715 West St
- 944 Stewart St
- 854 Woodward St
- 924 Glass Beach Dr
- 300 N Harbor Dr
- 1184 N Main St Unit 1
- 19351 Del Mar Dr
- 19701 Noyo Acres Dr
- 19171 S Harbor Dr
- 32000 Airport Rd
- 499 E Oak St
- 121 N Whipple St
- 127 N Whipple St
- 134 N Harrison St
- 135 N Whipple St
- 424 E Oak St
- 136 N Harrison St
- 426 E Oak St
- 111 S Whipple St
- 140 N Harrison St
- 143 N Whipple St
- 400 E Oak St
- 110 N Whipple St
- 120 N Whipple St
- 110 S Harrison St
- 117 S Whipple St
- 128 N Whipple St
- 100 S Whipple St
- 150 N Harrison St
- 120 S Harrison St