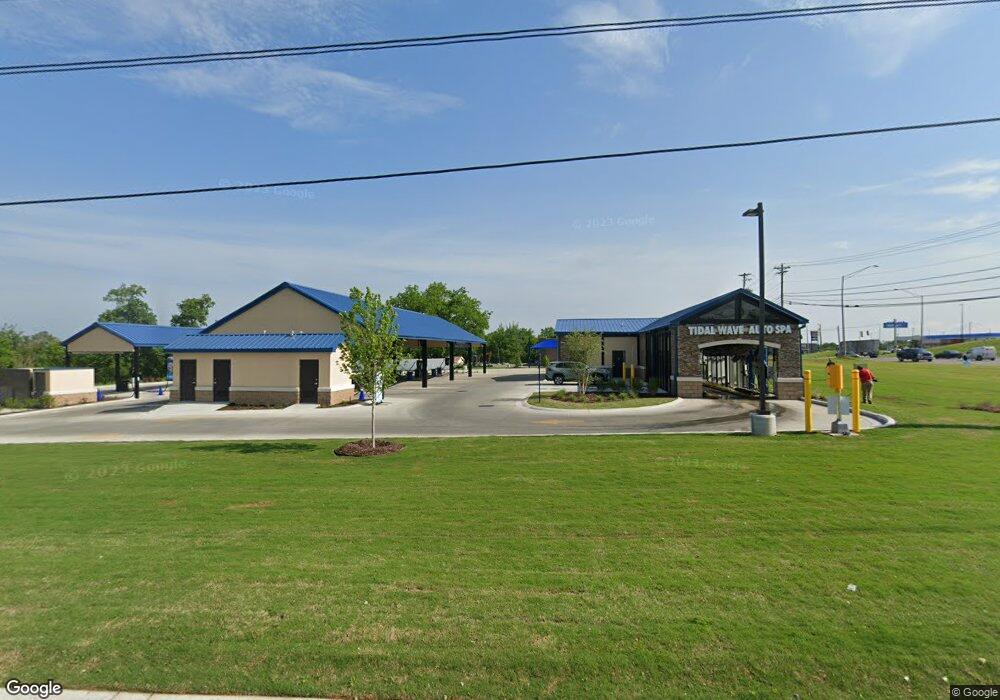
111 Northside Cir Shelbyville, TN 37160
Estimated Value: $6,420,965
--
Bed
2
Baths
5,244
Sq Ft
$1,224/Sq Ft
Est. Value
About This Home
This home is located at 111 Northside Cir, Shelbyville, TN 37160 and is currently estimated at $6,420,965, approximately $1,224 per square foot. 111 Northside Cir is a home located in Bedford County with nearby schools including Eakin Elementary School, Harris Middle School, and Victory Baptist Academy.
Ownership History
Date
Name
Owned For
Owner Type
Purchase Details
Closed on
Dec 19, 2022
Sold by
Twas Properties Llc
Bought by
Shelbyville Assets Llc
Current Estimated Value
Purchase Details
Closed on
Dec 30, 2021
Sold by
Patel Nayankumar K
Bought by
Twas Properties Llc
Purchase Details
Closed on
Aug 4, 2020
Sold by
Ruby Tuesday Inc
Bought by
Patel Nayankumar K
Home Financials for this Owner
Home Financials are based on the most recent Mortgage that was taken out on this home.
Original Mortgage
$816,000
Interest Rate
3.1%
Mortgage Type
Commercial
Purchase Details
Closed on
May 2, 2018
Sold by
Stephens Gladys R and Warren James R
Bought by
Shelbyville Crossing Llc
Home Financials for this Owner
Home Financials are based on the most recent Mortgage that was taken out on this home.
Original Mortgage
$2,111,415
Interest Rate
4.45%
Mortgage Type
Construction
Purchase Details
Closed on
Dec 30, 2004
Sold by
S & W Development
Bought by
Ruby Tuesday Inc
Purchase Details
Closed on
Nov 17, 2004
Bought by
Ruby Tuesday Inc
Create a Home Valuation Report for This Property
The Home Valuation Report is an in-depth analysis detailing your home's value as well as a comparison with similar homes in the area
Home Values in the Area
Average Home Value in this Area
Purchase History
| Date | Buyer | Sale Price | Title Company |
|---|---|---|---|
| Shelbyville Assets Llc | $5,945,946 | -- | |
| Twas Properties Llc | $1,525,000 | None Available | |
| Patel Nayankumar K | $960,000 | Fidelity National Ttl Ins Co | |
| Shelbyville Crossing Llc | $450,000 | Boston National Title Agency | |
| Ruby Tuesday Inc | $535,000 | -- | |
| S & W Development | -- | -- | |
| Ruby Tuesday Inc | $535,000 | -- |
Source: Public Records
Mortgage History
| Date | Status | Borrower | Loan Amount |
|---|---|---|---|
| Previous Owner | Patel Nayankumar K | $816,000 | |
| Previous Owner | Shelbyville Crossing Llc | $2,111,415 |
Source: Public Records
Tax History Compared to Growth
Tax History
| Year | Tax Paid | Tax Assessment Tax Assessment Total Assessment is a certain percentage of the fair market value that is determined by local assessors to be the total taxable value of land and additions on the property. | Land | Improvement |
|---|---|---|---|---|
| 2025 | -- | $720,720 | $0 | $0 |
| 2024 | -- | $720,720 | $227,240 | $493,480 |
| 2023 | $27,425 | $720,720 | $227,240 | $493,480 |
| 2022 | $11,633 | $297,120 | $227,240 | $69,880 |
| 2021 | $16,260 | $457,360 | $227,240 | $230,120 |
| 2020 | $19,705 | $457,360 | $227,240 | $230,120 |
| 2019 | $19,705 | $444,800 | $227,240 | $217,560 |
| 2018 | $19,260 | $444,800 | $227,240 | $217,560 |
| 2017 | $19,260 | $444,800 | $227,240 | $217,560 |
| 2016 | $19,082 | $444,800 | $227,240 | $217,560 |
| 2015 | $19,082 | $444,800 | $227,240 | $217,560 |
| 2014 | $16,812 | $428,870 | $0 | $0 |
Source: Public Records
Map
Nearby Homes
- 2315 U S 231
- 3124 U S 231
- 1931 Tennessee 82
- 2290 Midland Rd Unit 7A
- 2290 Midland Rd Unit 8B
- 2290 Midland Rd Unit 4A
- 108 Thoroughbred Blvd
- 1525 Green Ln
- 1523 Green Ln
- 1507 Green Ln
- 201 Hickory Dr
- 1505 Green Ln
- 321 Rolling Rd
- 323 Rolling Rd
- 318 Meadow Dr
- 114 Collier Ave
- 0 Archery Ln
- 1311 Glenoaks Rd
- 0 Hwy 231 N
- 129 Annas Way
- 1809 N Main St
- 1809 N Main St
- 1811 N Main St
- 3161 U S 231
- 2506 U S 231
- 0 U S 231
- 1813 N Main St
- 103 Moreland Ave
- 0 Tennessee 82
- 1620 Tennessee 82
- 3540 U S 231
- 205 Moreland Ave
- 0 Northside Cir Unit RTC2399137
- 0 Northside Cir Unit 2145111
- 0 Northside Cir Unit 2145110
- 0 Northside Cir Unit 2068703
- 0 Northside Cir Unit 2068702
- 0 Northside Cir Unit 2011228
- 104 Moreland Ave
- 1828 N Main St