
Seller's Agent in 2021
Luciane Ortis
Debella Realty
(603) 557-8904
2 in this area
164 Total Sales
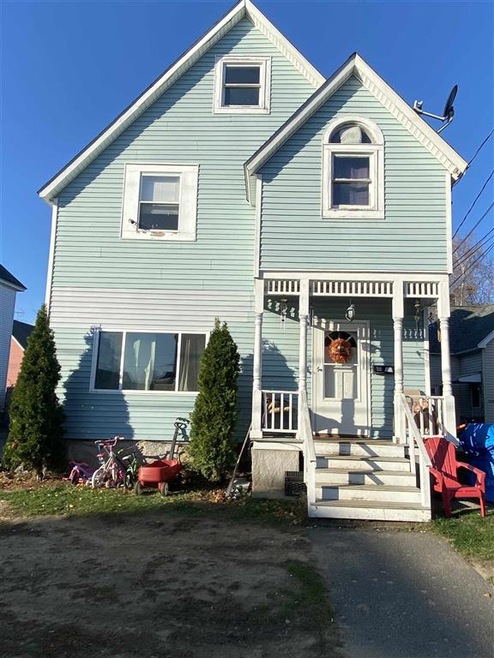
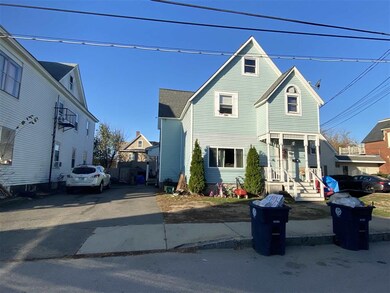
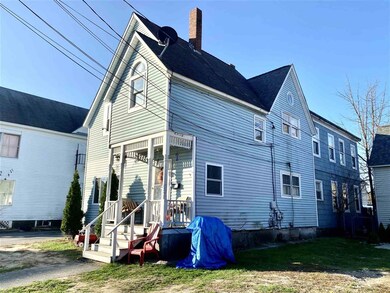
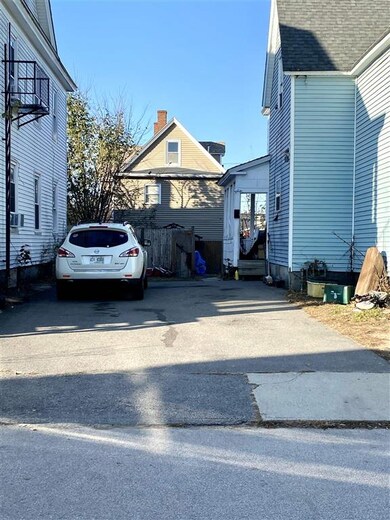
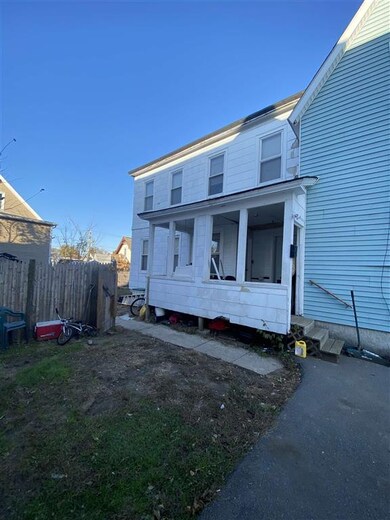

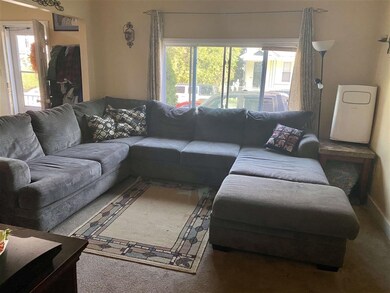
Come to see this opportunity to own a 2 family home in Nashua, townhouse style, driveway w/ 4 parking space and a fenced backyard. Front Unit has 4 bedrooms and 2 baths, and shingle roof is 13 years old. Back unit has 3 bedrooms, 1 bath and a membrane roof only 5 years old. GROUP SHOWING on 4/17 from 11-11:30am Sat. Agents pls see non remarks.
Home Type
Est. Annual Taxes
Year Built
Lot Details
Home Design
Interior Spaces
Basement
Parking
Schools
Utilities
Listing and Financial Details
Overview
Building Details
| Date | Type | Sale Price | Title Company |
|---|---|---|---|
| Warranty Deed | $375,000 | None Available | |
| Warranty Deed | $265,000 | -- | |
| Warranty Deed | $269,900 | -- | |
| Foreclosure Deed | $62,500 | -- |
| Date | Status | Loan Amount | Loan Type |
|---|---|---|---|
| Open | $368,207 | FHA | |
| Previous Owner | $260,200 | FHA | |
| Previous Owner | $215,900 | No Value Available | |
| Previous Owner | $62,420 | No Value Available |
| Date | Event | Price | Change | Sq Ft Price |
|---|---|---|---|---|
| 07/02/2021 07/02/21 | Sold | $375,000 | -1.3% | $99 / Sq Ft |
| 04/27/2021 04/27/21 | Pending | -- | -- | -- |
| 04/05/2021 04/05/21 | For Sale | $379,900 | 0.0% | $101 / Sq Ft |
| 04/05/2021 04/05/21 | Price Changed | $379,900 | +5.6% | $101 / Sq Ft |
| 02/01/2021 02/01/21 | Pending | -- | -- | -- |
| 02/01/2021 02/01/21 | For Sale | $359,900 | 0.0% | $95 / Sq Ft |
| 02/01/2021 02/01/21 | Price Changed | $359,900 | -4.0% | $95 / Sq Ft |
| 11/23/2020 11/23/20 | Off Market | $375,000 | -- | -- |
| 11/05/2020 11/05/20 | For Sale | $339,900 | +28.3% | $90 / Sq Ft |
| 12/18/2018 12/18/18 | Sold | $265,000 | 0.0% | $110 / Sq Ft |
| 11/12/2018 11/12/18 | Pending | -- | -- | -- |
| 10/31/2018 10/31/18 | For Sale | $265,000 | -- | $110 / Sq Ft |
| Year | Tax Paid | Tax Assessment Tax Assessment Total Assessment is a certain percentage of the fair market value that is determined by local assessors to be the total taxable value of land and additions on the property. | Land | Improvement |
|---|---|---|---|---|
| 2023 | $7,071 | $387,900 | $97,200 | $290,700 |
| 2022 | $7,009 | $387,900 | $97,200 | $290,700 |
| 2021 | $5,663 | $243,900 | $64,800 | $179,100 |
| 2020 | $5,515 | $243,900 | $64,800 | $179,100 |
| 2019 | $5,307 | $243,900 | $64,800 | $179,100 |
| 2018 | $5,173 | $243,900 | $64,800 | $179,100 |
| 2017 | $4,818 | $186,800 | $61,200 | $125,600 |
| 2016 | $4,683 | $186,800 | $61,200 | $125,600 |
| 2015 | $4,582 | $186,800 | $61,200 | $125,600 |
| 2014 | $4,493 | $186,800 | $61,200 | $125,600 |
Seller's Agent in 2021
Luciane Ortis
Debella Realty
(603) 557-8904
2 in this area
164 Total Sales
Buyer's Agent in 2021
Chelsea Leveille
Keller Williams Realty-Metropolitan
(603) 765-6749
2 in this area
155 Total Sales
Seller's Agent in 2018
Craig Labrecque
MFH Realty
(603) 557-4641
18 Total Sales
M
Buyer's Agent in 2018
Mariana Silva
Albert Invest Realty Group
(603) 438-4263
8 in this area
161 Total Sales
Source: PrimeMLS
MLS Number: 4837431
APN: NASH-000096-000000-000058
Disclaimer: Certain information contained herein is derived from information provided by parties other than Homes.com. All information provided is deemed reliable, but is not guaranteed to be accurate and should be independently verified.
![]() Copyright 2025 PrimeMLS, Inc. All rights reserved. This information is deemed reliable, but not guaranteed. The data relating to real estate displayed on this display comes in part from the IDX Program of PrimeMLS. The information being provided is for consumers’ personal, non-commercial use and may not be used for any purpose other than to identify prospective properties consumers may be interested in purchasing.
Copyright 2025 PrimeMLS, Inc. All rights reserved. This information is deemed reliable, but not guaranteed. The data relating to real estate displayed on this display comes in part from the IDX Program of PrimeMLS. The information being provided is for consumers’ personal, non-commercial use and may not be used for any purpose other than to identify prospective properties consumers may be interested in purchasing.