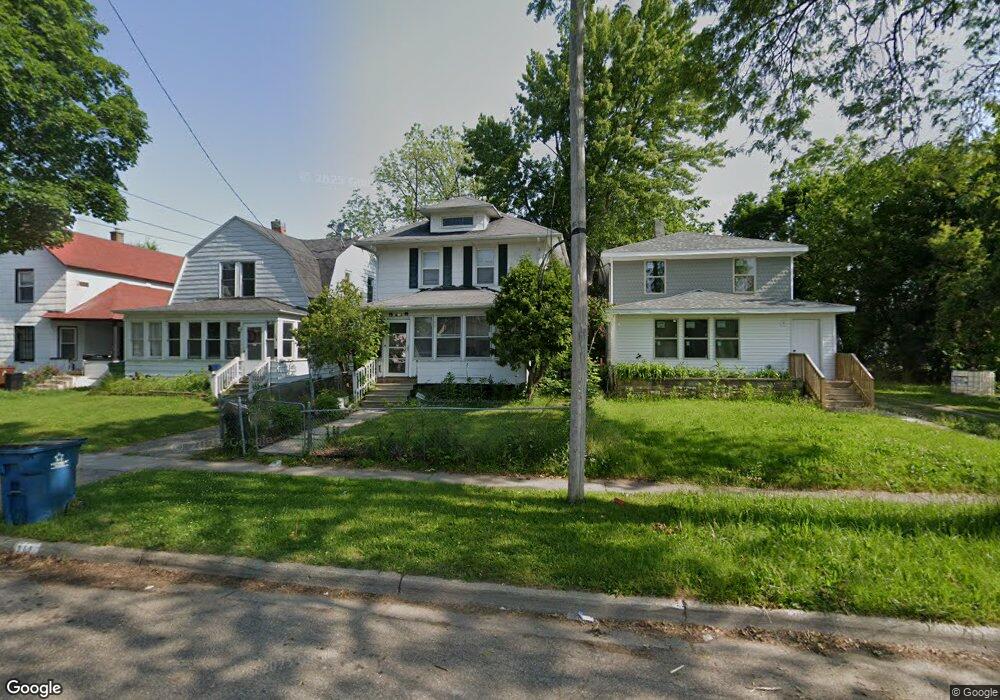
111 Post Ave Battle Creek, MI 49014
Post Franklin NeighborhoodEstimated Value: $80,000 - $111,000
4
Beds
2
Baths
1,424
Sq Ft
$65/Sq Ft
Est. Value
About This Home
This home is located at 111 Post Ave, Battle Creek, MI 49014 and is currently estimated at $92,198, approximately $64 per square foot. 111 Post Ave is a home located in Calhoun County with nearby schools including Post-Franklin Elementary School, Springfield Middle School, and Battle Creek Central High School.
Ownership History
Date
Name
Owned For
Owner Type
Purchase Details
Closed on
Jan 27, 2015
Sold by
Lytle Terrence
Bought by
The Terrence Daquawn Lytle & Erica Moniq
Current Estimated Value
Purchase Details
Closed on
Sep 19, 2007
Sold by
Todd Josita T
Bought by
Todd Josita D and Josita Todd Living Trust 2007
Purchase Details
Closed on
Feb 28, 2003
Bought by
Todd Josita T
Purchase Details
Closed on
Sep 11, 1996
Bought by
Lundy
Purchase Details
Closed on
Jan 10, 1995
Bought by
Neighborhoods Inc
Create a Home Valuation Report for This Property
The Home Valuation Report is an in-depth analysis detailing your home's value as well as a comparison with similar homes in the area
Home Values in the Area
Average Home Value in this Area
Purchase History
| Date | Buyer | Sale Price | Title Company |
|---|---|---|---|
| The Terrence Daquawn Lytle & Erica Moniq | -- | None Available | |
| Todd Josita D | -- | None Available | |
| Todd Josita T | $39,400 | -- | |
| Lundy | $39,400 | -- | |
| Neighborhoods Inc | -- | -- |
Source: Public Records
Tax History Compared to Growth
Tax History
| Year | Tax Paid | Tax Assessment Tax Assessment Total Assessment is a certain percentage of the fair market value that is determined by local assessors to be the total taxable value of land and additions on the property. | Land | Improvement |
|---|---|---|---|---|
| 2025 | -- | $38,200 | $0 | $0 |
| 2024 | $835 | $32,086 | $0 | $0 |
| 2023 | $955 | $29,557 | $0 | $0 |
| 2022 | $755 | $23,620 | $0 | $0 |
| 2021 | $901 | $22,213 | $0 | $0 |
| 2020 | $847 | $20,807 | $0 | $0 |
| 2019 | $868 | $20,589 | $0 | $0 |
| 2018 | $868 | $18,226 | $330 | $17,896 |
| 2017 | $1,052 | $20,465 | $0 | $0 |
| 2016 | $1,078 | $23,361 | $0 | $0 |
| 2015 | $923 | $24,343 | $1,638 | $22,705 |
| 2014 | $923 | $16,736 | $1,638 | $15,098 |
Source: Public Records
Map
Nearby Homes
- 57 Euclid St
- 100 Illinois St
- 180 Grenville St
- 118 Nelson St
- 130 Cliff St
- 232 Cliff St
- 50 Douglas St
- 418 Main St
- 136 Jericho Rd
- 117 Inn Rd
- 501 Michigan Ave E
- 507 Michigan Ave E
- 390 E Michigan Ave
- 76 Taft St
- 47 Alden Ave W
- 802 Michigan Ave E
- 519 S Shore Dr
- 51 Pauline Ave
- 503 S Shore Dr
- 156 Woodway Ave