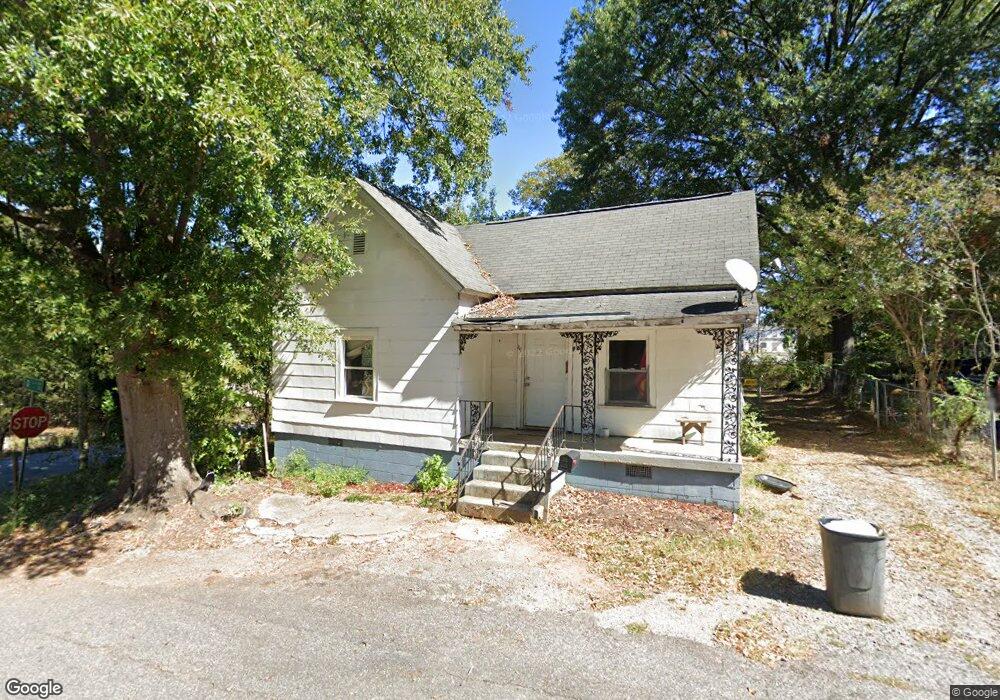
111 Q St Anderson, SC 29625
Estimated Value: $60,000 - $110,000
2
Beds
--
Bath
1,116
Sq Ft
$66/Sq Ft
Est. Value
About This Home
This home is located at 111 Q St, Anderson, SC 29625 and is currently estimated at $74,129, approximately $66 per square foot. 111 Q St is a home located in Anderson County with nearby schools including Centerville Elementary School, Anderson Institute of Technology, and Westside High School.
Ownership History
Date
Name
Owned For
Owner Type
Purchase Details
Closed on
May 8, 2014
Sold by
Fidelity Investments Llc
Bought by
Knight Rickey
Current Estimated Value
Purchase Details
Closed on
May 7, 2014
Sold by
Palmetto Liquidation Services Llc
Bought by
Fidelity Investments Llc
Purchase Details
Closed on
Feb 15, 2008
Sold by
Southern Solutions Inc
Bought by
Eloy Investments Llc
Purchase Details
Closed on
Sep 6, 2006
Sold by
Limbaugh Shirley
Bought by
Southern Solutions Inc
Purchase Details
Closed on
Jun 20, 2002
Sold by
Morris Jennifer R
Bought by
Mcdaniel Rory C
Create a Home Valuation Report for This Property
The Home Valuation Report is an in-depth analysis detailing your home's value as well as a comparison with similar homes in the area
Home Values in the Area
Average Home Value in this Area
Purchase History
| Date | Buyer | Sale Price | Title Company |
|---|---|---|---|
| Knight Rickey | $4,000 | -- | |
| Fidelity Investments Llc | $3,000 | -- | |
| Eloy Investments Llc | -- | -- | |
| Southern Solutions Inc | $14,706 | None Available | |
| Mcdaniel Rory C | $77,500 | -- |
Source: Public Records
Tax History Compared to Growth
Tax History
| Year | Tax Paid | Tax Assessment Tax Assessment Total Assessment is a certain percentage of the fair market value that is determined by local assessors to be the total taxable value of land and additions on the property. | Land | Improvement |
|---|---|---|---|---|
| 2024 | $326 | $700 | $220 | $480 |
| 2023 | $326 | $700 | $220 | $480 |
| 2022 | $290 | $700 | $220 | $480 |
| 2021 | $277 | $620 | $210 | $410 |
| 2020 | $270 | $620 | $210 | $410 |
| 2019 | $270 | $620 | $210 | $410 |
| 2018 | $268 | $620 | $210 | $410 |
| 2017 | -- | $620 | $210 | $410 |
| 2016 | $258 | $600 | $210 | $390 |
| 2015 | $257 | $600 | $210 | $390 |
| 2014 | $250 | $1,280 | $210 | $1,070 |
Source: Public Records
Map
Nearby Homes