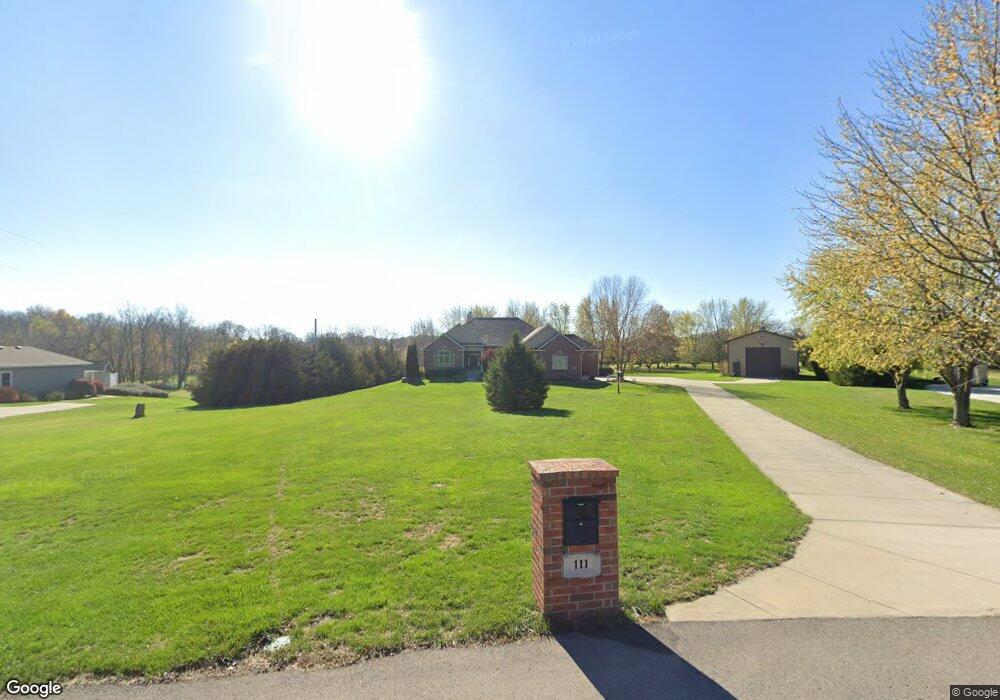
111 Rock Creek Loop Lansing, KS 66043
Estimated Value: $555,000 - $750,081
4
Beds
4
Baths
3,321
Sq Ft
$192/Sq Ft
Est. Value
About This Home
This home is located at 111 Rock Creek Loop, Lansing, KS 66043 and is currently estimated at $637,694, approximately $192 per square foot. 111 Rock Creek Loop is a home located in Leavenworth County with nearby schools including Lansing Elementary School, Lansing Middle 6-8, and Lansing High 9-12.
Ownership History
Date
Name
Owned For
Owner Type
Purchase Details
Closed on
May 1, 2004
Bought by
Tytla Family Wealth
Current Estimated Value
Home Financials for this Owner
Home Financials are based on the most recent Mortgage that was taken out on this home.
Original Mortgage
$427,500
Outstanding Balance
$304,409
Interest Rate
6.01%
Mortgage Type
VA
Estimated Equity
$333,285
Create a Home Valuation Report for This Property
The Home Valuation Report is an in-depth analysis detailing your home's value as well as a comparison with similar homes in the area
Home Values in the Area
Average Home Value in this Area
Purchase History
| Date | Buyer | Sale Price | Title Company |
|---|---|---|---|
| Tytla Family Wealth | $110,000 | -- |
Source: Public Records
Mortgage History
| Date | Status | Borrower | Loan Amount |
|---|---|---|---|
| Open | Tytla Family Wealth | $427,500 | |
| Closed | Tytla Family Wealth | $443,000 |
Source: Public Records
Tax History Compared to Growth
Tax History
| Year | Tax Paid | Tax Assessment Tax Assessment Total Assessment is a certain percentage of the fair market value that is determined by local assessors to be the total taxable value of land and additions on the property. | Land | Improvement |
|---|---|---|---|---|
| 2025 | $11,352 | $86,125 | $9,538 | $76,587 |
| 2024 | $10,458 | $82,813 | $10,985 | $71,828 |
| 2023 | $10,458 | $79,627 | $10,985 | $68,642 |
| 2022 | $10,055 | $72,388 | $8,600 | $63,788 |
| 2021 | $9,444 | $65,215 | $8,600 | $56,615 |
| 2020 | $9,140 | $62,110 | $8,600 | $53,510 |
| 2019 | $8,965 | $60,842 | $8,600 | $52,242 |
| 2018 | $8,614 | $58,502 | $8,600 | $49,902 |
| 2017 | $8,158 | $55,297 | $8,600 | $46,697 |
| 2016 | $8,081 | $54,750 | $8,600 | $46,150 |
| 2015 | $8,057 | $54,749 | $10,818 | $43,931 |
| 2014 | $8,721 | $60,462 | $10,818 | $49,644 |
Source: Public Records
Map
Nearby Homes
- 131 Rock Creek Loop
- 705 Rock Creek Dr
- 115 W Gilman Rd
- 24431 139th St
- 875 Clearview Dr
- 13788 McIntyre2 Rd
- 13788 McIntyre1 Rd
- 13788 Mcintyre Rd
- 13965 Mc Intyre Rd
- 833 Rock Creek Dr
- 922 Southfork St
- 1221 S Desoto Rd
- 901 S Main St
- 811 4-H Rd
- 722 Bittersweet Rd
- 624 S Bittersweet Ln
- 000 4-H Rd
- Lot 2 139th St
- 104 Olive St
- 527 S Valley Dr
- 109 Rock Creek Loop
- 113 Rock Creek Loop
- 110 Rock Creek Loop
- 117 Rock Creek Loop
- 104 Rock Creek Loop
- 105 Rock Creek Loop
- 107 Rock Creek Loop
- 118 Rock Creek Loop
- 103 Rock Creek Loop
- 119 Rock Creek Loop
- 180 Canyon View Dr
- 178 Canyon View Dr
- 182 Canyon View Dr
- 176 Canyon View Dr
- 184 Canyon View Dr
- 186 Canyon View Dr
- 128 Rock Creek Loop
- 174 Canyon View Dr
- 121 Rock Creek Loop
- 188 Canyon View Dr