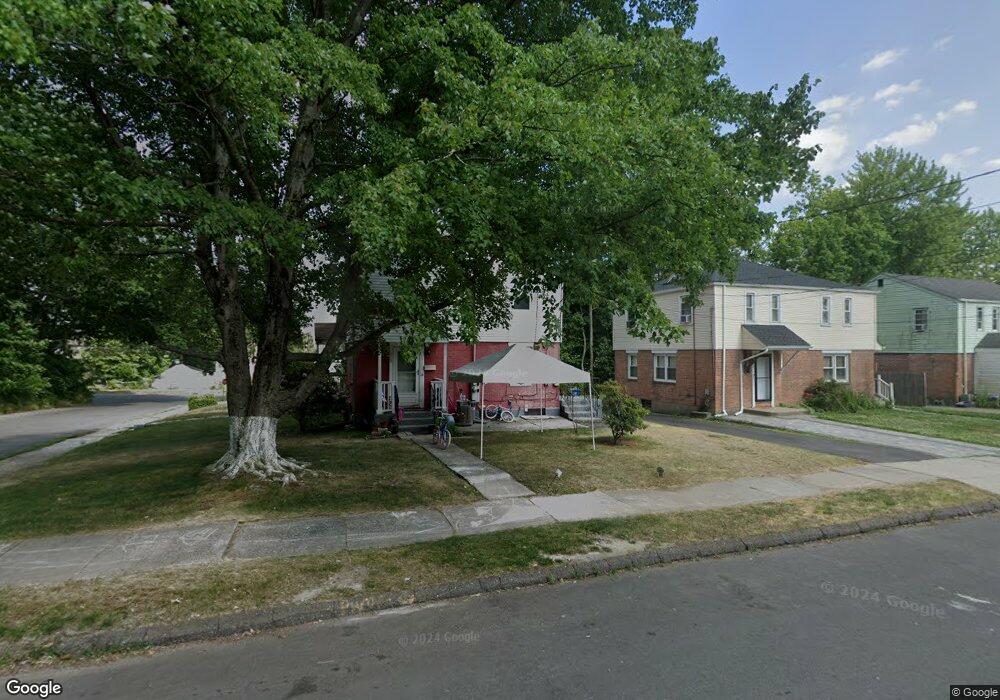
111 Rosemont St Unit 113 Hartford, CT 06120
North End NeighborhoodEstimated Value: $202,000 - $254,000
4
Beds
2
Baths
1,600
Sq Ft
$148/Sq Ft
Est. Value
About This Home
This home is located at 111 Rosemont St Unit 113, Hartford, CT 06120 and is currently estimated at $236,328, approximately $147 per square foot. 111 Rosemont St Unit 113 is a home located in Hartford County with nearby schools including Capital Preparatory Magnet School, Perry Elementary School, and Ib Global Communications Academy.
Ownership History
Date
Name
Owned For
Owner Type
Purchase Details
Closed on
Jul 19, 2022
Sold by
Robertson Gregory
Bought by
Astwood Nmarshall
Current Estimated Value
Home Financials for this Owner
Home Financials are based on the most recent Mortgage that was taken out on this home.
Original Mortgage
$139,244
Outstanding Balance
$132,445
Interest Rate
5.23%
Mortgage Type
FHA
Estimated Equity
$103,883
Purchase Details
Closed on
Feb 3, 2015
Sold by
111 113 Rosemont Llc
Bought by
Helen B Nixon Lt and Robertson
Purchase Details
Closed on
Feb 27, 1987
Sold by
Adams Addie M
Bought by
Robertson Gregory
Home Financials for this Owner
Home Financials are based on the most recent Mortgage that was taken out on this home.
Original Mortgage
$52,000
Interest Rate
9.19%
Mortgage Type
Purchase Money Mortgage
Create a Home Valuation Report for This Property
The Home Valuation Report is an in-depth analysis detailing your home's value as well as a comparison with similar homes in the area
Home Values in the Area
Average Home Value in this Area
Purchase History
| Date | Buyer | Sale Price | Title Company |
|---|---|---|---|
| Astwood Nmarshall | $161,000 | None Available | |
| Helen B Nixon Lt | -- | -- | |
| Robertson Gregory | $65,000 | -- |
Source: Public Records
Mortgage History
| Date | Status | Borrower | Loan Amount |
|---|---|---|---|
| Open | Astwood Nmarshall | $139,244 | |
| Previous Owner | Robertson Gregory | $52,000 |
Source: Public Records
Tax History Compared to Growth
Tax History
| Year | Tax Paid | Tax Assessment Tax Assessment Total Assessment is a certain percentage of the fair market value that is determined by local assessors to be the total taxable value of land and additions on the property. | Land | Improvement |
|---|---|---|---|---|
| 2025 | $3,826 | $55,493 | $5,990 | $49,503 |
| 2024 | $3,826 | $55,493 | $5,990 | $49,503 |
| 2023 | $3,826 | $55,493 | $5,990 | $49,503 |
| 2022 | $3,154 | $55,493 | $5,990 | $49,503 |
| 2021 | $3,154 | $42,455 | $5,915 | $36,540 |
| 2020 | $3,154 | $42,455 | $5,915 | $36,540 |
| 2019 | $3,154 | $42,455 | $5,915 | $36,540 |
| 2018 | $3,048 | $41,024 | $5,716 | $35,308 |
| 2016 | $3,230 | $43,484 | $5,444 | $38,040 |
| 2015 | $3,230 | $43,474 | $5,185 | $38,289 |
| 2014 | $3,151 | $42,411 | $5,058 | $37,353 |
Source: Public Records
Map
Nearby Homes
- 82 Ashford St Unit 84
- 70 Ashford St
- 14 Bennett Cir
- 75 Cleveland Ave
- 2657 Main St Unit 2659
- 142 Clark St
- 158 Martin St Unit 160
- 25 Judson St Unit C
- 35 Loomis St
- 33 Warren St
- 275 Westland St
- 175 E Pershing St
- 238 Enfield St Unit 240
- 270 Bellevue St
- 117 E Harold St
- 39 Capen St
- 97 Boothbay St
- 551 Garden St Unit 553
- 36 Baltic St Unit 38
- 97 E Burnham St
- 101 Rosemont St
- 37 Cambridge St
- 36 Rutland St Unit 38
- 33 Cambridge St
- 32 Rutland St Unit 34
- 96 Rosemont St
- 29 Cambridge St
- 95 Rosemont St
- 92 Rosemont St
- 25 Cambridge St
- 26 Rutland St
- 121 Rosemont St Unit 123
- 91 Rosemont St
- 28 Rutland St Unit 30
- 28 Rutland St
- 35 Rutland St
- 58 Cambridge St
- 33 Rutland St Unit 35
- 24 Rutland St
- 28 Cambridge St