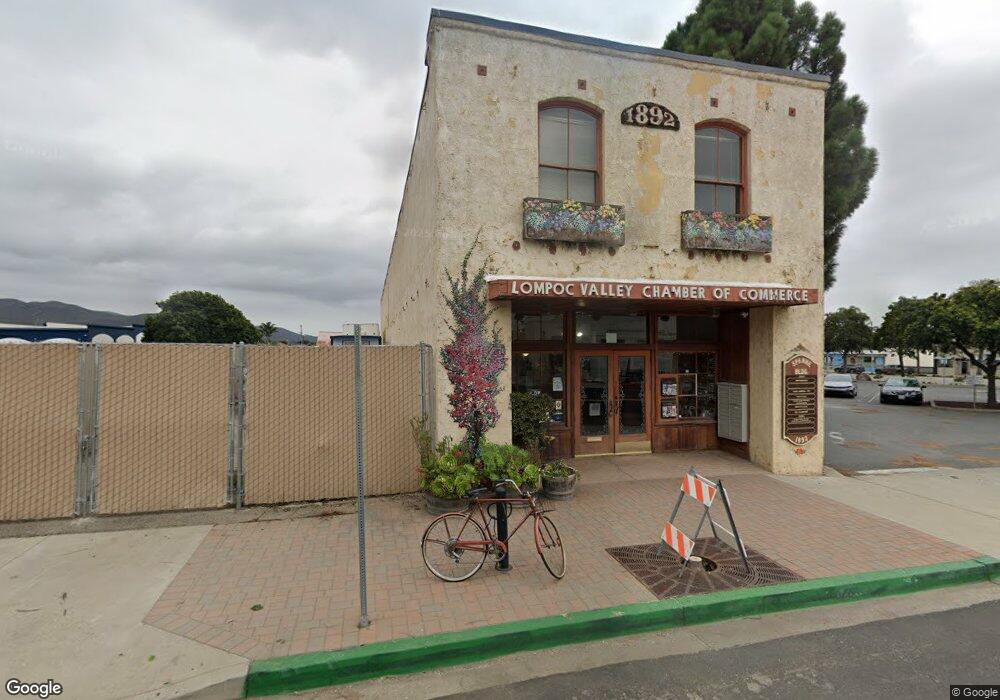
111 S I St Lompoc, CA 93436
Estimated Value: $789,212
Studio
--
Bath
6,000
Sq Ft
$132/Sq Ft
Est. Value
About This Home
This home is located at 111 S I St, Lompoc, CA 93436 and is currently estimated at $789,212, approximately $131 per square foot. 111 S I St is a home located in Santa Barbara County with nearby schools including Arthur Hapgood Elementary School, Lompoc Valley Middle School, and Lompoc High School.
Ownership History
Date
Name
Owned For
Owner Type
Purchase Details
Closed on
Jun 20, 2018
Sold by
Lompoc Valley Chamber Of Commerce And Vi
Bought by
Arevalo Elena J and Arevalo Family Trust
Current Estimated Value
Purchase Details
Closed on
Nov 19, 2003
Sold by
Spanne 1892 Ltd
Bought by
Lompoc Valley Chamber Of Commerce & Visi
Home Financials for this Owner
Home Financials are based on the most recent Mortgage that was taken out on this home.
Original Mortgage
$465,000
Interest Rate
5.35%
Mortgage Type
Commercial
Purchase Details
Closed on
Nov 8, 2002
Sold by
Grande Josephine
Bought by
Spanne 1892 Ltd
Purchase Details
Closed on
Nov 7, 2002
Sold by
Spanne 1892 Ltd
Bought by
Grande Josephine
Create a Home Valuation Report for This Property
The Home Valuation Report is an in-depth analysis detailing your home's value as well as a comparison with similar homes in the area
Home Values in the Area
Average Home Value in this Area
Purchase History
| Date | Buyer | Sale Price | Title Company |
|---|---|---|---|
| Arevalo Elena J | $483,000 | First American Title Co | |
| Lompoc Valley Chamber Of Commerce & Visi | $485,000 | Chicago Title Company | |
| Spanne 1892 Ltd | -- | Chicago Title | |
| Grande Josephine | -- | Chicago Title |
Source: Public Records
Mortgage History
| Date | Status | Borrower | Loan Amount |
|---|---|---|---|
| Previous Owner | Lompoc Valley Chamber Of Commerce & Visi | $465,000 |
Source: Public Records
Tax History
| Year | Tax Paid | Tax Assessment Tax Assessment Total Assessment is a certain percentage of the fair market value that is determined by local assessors to be the total taxable value of land and additions on the property. | Land | Improvement |
|---|---|---|---|---|
| 2025 | $6,151 | $556,728 | $113,781 | $442,947 |
| 2023 | $6,151 | $538,219 | $109,363 | $428,856 |
| 2022 | $6,073 | $529,112 | $107,219 | $421,893 |
| 2021 | $6,156 | $520,308 | $105,117 | $415,191 |
| 2020 | $6,114 | $517,043 | $104,040 | $413,003 |
| 2019 | $6,044 | $509,500 | $102,000 | $407,500 |
| 2018 | $7,594 | $640,077 | $108,225 | $531,852 |
| 2017 | $7,482 | $629,756 | $106,103 | $523,653 |
| 2016 | $7,410 | $622,744 | $104,023 | $518,721 |
| 2014 | $7,190 | $596,110 | $100,454 | $495,656 |
Source: Public Records
Map
Nearby Homes
Your Personal Tour Guide
Ask me questions while you tour the home.