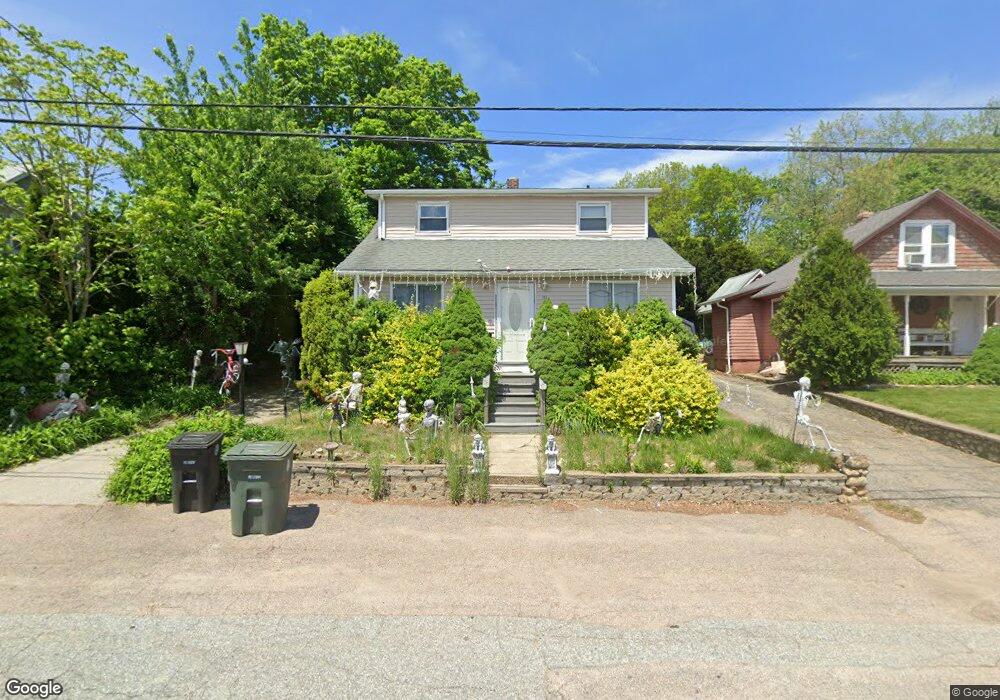
111 Shippee Ave Coventry, RI 02816
West Warwick Centre NeighborhoodEstimated Value: $367,000 - $382,000
2
Beds
2
Baths
1,377
Sq Ft
$270/Sq Ft
Est. Value
About This Home
This home is located at 111 Shippee Ave, Coventry, RI 02816 and is currently estimated at $372,465, approximately $270 per square foot. 111 Shippee Ave is a home located in Kent County with nearby schools including Alan Shawn Feinstein Ms Of Cov, Coventry High School, and Islamic School of Rhode Island.
Ownership History
Date
Name
Owned For
Owner Type
Purchase Details
Closed on
Nov 3, 2008
Sold by
Fisher Robert W and Fisher Kristina E
Bought by
Sereduck Keith J and Sereduck Savana B
Current Estimated Value
Home Financials for this Owner
Home Financials are based on the most recent Mortgage that was taken out on this home.
Original Mortgage
$175,681
Interest Rate
5.83%
Mortgage Type
Purchase Money Mortgage
Purchase Details
Closed on
Feb 1, 2005
Sold by
Harper Gregory D
Bought by
Fisher Robert W and Fisher Kristina E
Purchase Details
Closed on
May 9, 2000
Sold by
Shearler Gary E
Bought by
Harper Gregory D and Reichstetter Amy
Create a Home Valuation Report for This Property
The Home Valuation Report is an in-depth analysis detailing your home's value as well as a comparison with similar homes in the area
Home Values in the Area
Average Home Value in this Area
Purchase History
| Date | Buyer | Sale Price | Title Company |
|---|---|---|---|
| Sereduck Keith J | $178,000 | -- | |
| Fisher Robert W | $225,000 | -- | |
| Harper Gregory D | $93,000 | -- |
Source: Public Records
Mortgage History
| Date | Status | Borrower | Loan Amount |
|---|---|---|---|
| Open | Harper Gregory D | $166,585 | |
| Closed | Harper Gregory D | $175,681 | |
| Closed | Harper Gregory D | $4,900 |
Source: Public Records
Tax History
| Year | Tax Paid | Tax Assessment Tax Assessment Total Assessment is a certain percentage of the fair market value that is determined by local assessors to be the total taxable value of land and additions on the property. | Land | Improvement |
|---|---|---|---|---|
| 2025 | $3,997 | $248,400 | $75,900 | $172,500 |
| 2024 | $3,935 | $248,400 | $75,900 | $172,500 |
| 2023 | $3,808 | $248,400 | $75,900 | $172,500 |
| 2022 | $3,589 | $183,400 | $72,600 | $110,800 |
| 2021 | $3,558 | $183,400 | $72,600 | $110,800 |
| 2020 | $4,079 | $183,400 | $72,600 | $110,800 |
| 2019 | $2,976 | $133,800 | $35,600 | $98,200 |
| 2018 | $2,891 | $133,800 | $35,600 | $98,200 |
| 2017 | $2,807 | $133,800 | $35,600 | $98,200 |
| 2016 | $2,696 | $125,900 | $33,700 | $92,200 |
| 2015 | $2,622 | $125,900 | $33,700 | $92,200 |
| 2014 | $2,568 | $125,900 | $33,700 | $92,200 |
| 2013 | $2,482 | $133,000 | $40,800 | $92,200 |
Source: Public Records
Map
Nearby Homes
Your Personal Tour Guide
Ask me questions while you tour the home.