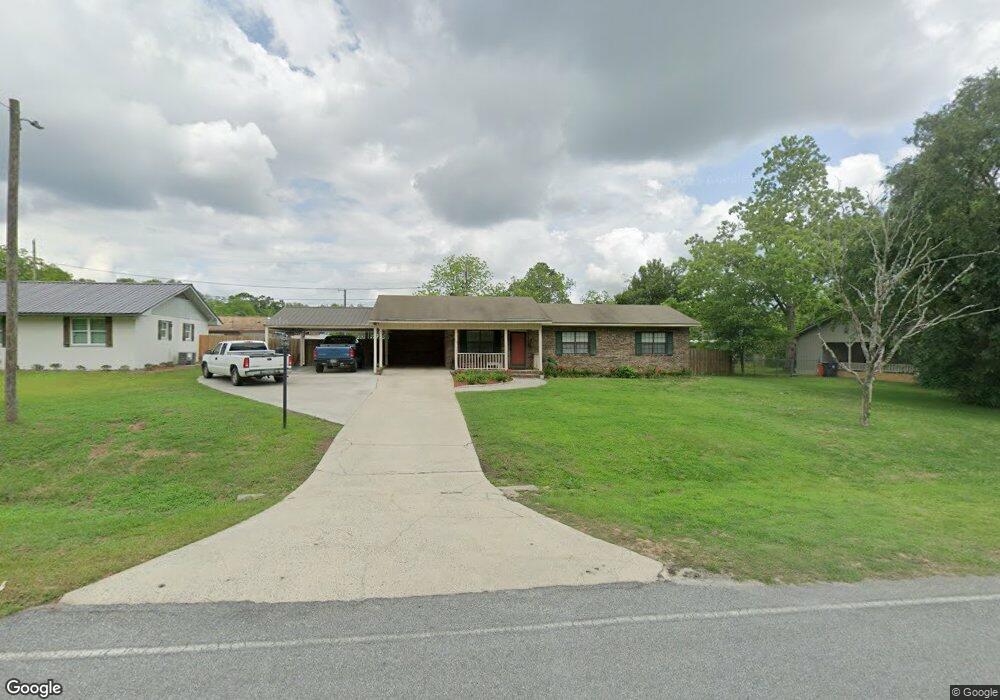
111 Weldon Way Fitzgerald, GA 31750
Estimated Value: $82,000 - $165,978
3
Beds
2
Baths
1,532
Sq Ft
$80/Sq Ft
Est. Value
About This Home
This home is located at 111 Weldon Way, Fitzgerald, GA 31750 and is currently estimated at $122,745, approximately $80 per square foot. 111 Weldon Way is a home located in Ben Hill County with nearby schools including Ben Hill County Primary School, Ben Hill Elementary School, and Ben Hill County Middle School.
Ownership History
Date
Name
Owned For
Owner Type
Purchase Details
Closed on
Jun 26, 2025
Sold by
Associated Partners Too Llc
Bought by
Boice Karen Underwood
Current Estimated Value
Purchase Details
Closed on
Jul 2, 2024
Sold by
Associated Partners
Bought by
Associated Partners
Purchase Details
Closed on
Aug 30, 2021
Sold by
Nelms Judy F
Bought by
Boice Karen Underwood
Purchase Details
Closed on
Apr 24, 2017
Sold by
Nelms Judy F
Bought by
Nelms Judy F and Boice Karen Underwood
Purchase Details
Closed on
Oct 27, 2016
Sold by
Billy A
Bought by
Nelms Judy F
Purchase Details
Closed on
Sep 16, 2005
Sold by
Nelms Judy
Bought by
Nelms Billy A
Purchase Details
Closed on
Nov 12, 1998
Sold by
Kunkler Daniel
Bought by
Nelms Nelms B and Nelms Judy
Purchase Details
Closed on
Jun 9, 1992
Bought by
Kunkler Daniel
Create a Home Valuation Report for This Property
The Home Valuation Report is an in-depth analysis detailing your home's value as well as a comparison with similar homes in the area
Home Values in the Area
Average Home Value in this Area
Purchase History
| Date | Buyer | Sale Price | Title Company |
|---|---|---|---|
| Boice Karen Underwood | $76,880 | -- | |
| Associated Partners | -- | -- | |
| Associated Partners | $62,000 | -- | |
| Boice Karen Underwood | -- | -- | |
| Nelms Judy F | -- | -- | |
| Nelms Judy F | -- | -- | |
| Nelms Billy A | -- | -- | |
| Nelms Nelms B | $54,000 | -- | |
| Kunkler Daniel | $50,000 | -- |
Source: Public Records
Tax History Compared to Growth
Tax History
| Year | Tax Paid | Tax Assessment Tax Assessment Total Assessment is a certain percentage of the fair market value that is determined by local assessors to be the total taxable value of land and additions on the property. | Land | Improvement |
|---|---|---|---|---|
| 2024 | $1,958 | $45,893 | $2,800 | $43,093 |
| 2023 | $1,996 | $44,285 | $2,800 | $41,485 |
| 2022 | $1,288 | $38,949 | $2,800 | $36,149 |
| 2021 | $1,037 | $36,170 | $2,800 | $33,370 |
| 2020 | $1,026 | $35,523 | $2,800 | $32,723 |
| 2019 | $1,022 | $35,523 | $2,800 | $32,723 |
| 2018 | $1,521 | $35,304 | $2,800 | $32,504 |
| 2017 | $1,021 | $35,354 | $2,800 | $32,554 |
| 2016 | $971 | $35,211 | $2,800 | $32,411 |
| 2015 | -- | $34,654 | $2,800 | $31,854 |
| 2014 | -- | $35,619 | $3,200 | $32,419 |
Source: Public Records
Map
Nearby Homes
- 111 Duane Dr
- 109 Pearl Place
- 204 Irwinville Hwy
- 200 Irwinville Hwy
- 141 Turner Ave
- 137 Atlantic Ave
- 118 Patton Ave
- 249 Lincoln Ave
- 138 Azalea Ln
- 0 Lincoln Ave
- 271 Lincoln Ave
- 105 Halsey St
- 277 Lincoln Ave
- 118 Irwinville Hwy
- 107 Manassas Place
- 102 Irwinville Hwy
- 906 N Merrimac Dr
- 807 W Oconee St
- 103 Meadowood Ln
- 113 S Merrimac Dr