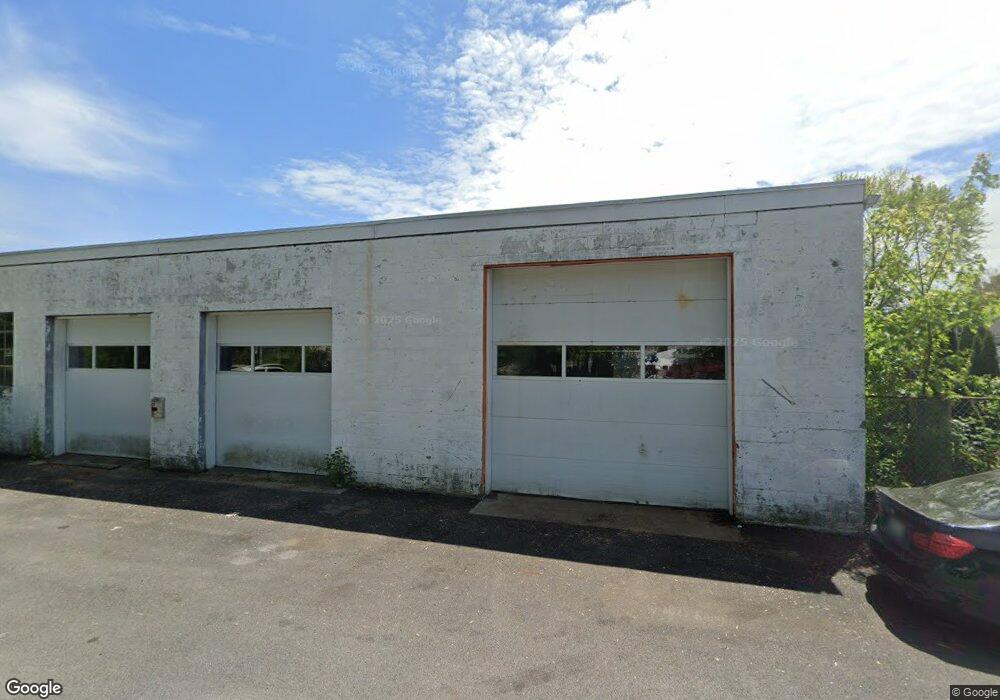
111 West St West Warwick, RI 02893
West Warwick Centre NeighborhoodEstimated Value: $314,805
Studio
--
Bath
4,800
Sq Ft
$66/Sq Ft
Est. Value
About This Home
This home is located at 111 West St, West Warwick, RI 02893 and is currently estimated at $314,805, approximately $65 per square foot. 111 West St is a home located in Kent County with nearby schools including West Warwick High School and Islamic School of Rhode Island.
Ownership History
Date
Name
Owned For
Owner Type
Purchase Details
Closed on
Apr 28, 2016
Sold by
Reed William E
Bought by
Tourin Motabella Grand
Current Estimated Value
Home Financials for this Owner
Home Financials are based on the most recent Mortgage that was taken out on this home.
Original Mortgage
$150,000
Outstanding Balance
$119,682
Interest Rate
3.73%
Mortgage Type
Commercial
Estimated Equity
$195,123
Purchase Details
Closed on
Jul 21, 2010
Sold by
Zip Lock Rlty
Bought by
Reed William E
Purchase Details
Closed on
Apr 29, 2010
Sold by
Green Sands Rlty
Bought by
Zip Lock Rlty
Create a Home Valuation Report for This Property
The Home Valuation Report is an in-depth analysis detailing your home's value as well as a comparison with similar homes in the area
Home Values in the Area
Average Home Value in this Area
Purchase History
| Date | Buyer | Sale Price | Title Company |
|---|---|---|---|
| Tourin Motabella Grand | $150,000 | -- | |
| Reed William E | -- | -- | |
| Zip Lock Rlty | -- | -- |
Source: Public Records
Mortgage History
| Date | Status | Borrower | Loan Amount |
|---|---|---|---|
| Open | Tourin Motabella Grand | $150,000 |
Source: Public Records
Tax History
| Year | Tax Paid | Tax Assessment Tax Assessment Total Assessment is a certain percentage of the fair market value that is determined by local assessors to be the total taxable value of land and additions on the property. | Land | Improvement |
|---|---|---|---|---|
| 2025 | $8,046 | $319,300 | $111,600 | $207,700 |
| 2024 | $7,235 | $226,100 | $79,300 | $146,800 |
| 2023 | $7,093 | $226,100 | $79,300 | $146,800 |
| 2022 | $6,982 | $226,100 | $79,300 | $146,800 |
| 2021 | $7,238 | $223,200 | $47,700 | $175,500 |
| 2020 | $7,238 | $223,200 | $47,700 | $175,500 |
| 2019 | $7,102 | $223,200 | $47,700 | $175,500 |
| 2018 | $6,347 | $191,300 | $46,200 | $145,100 |
| 2017 | $6,145 | $191,300 | $46,200 | $145,100 |
| 2016 | $6,034 | $191,300 | $46,200 | $145,100 |
| 2015 | $5,870 | $186,100 | $44,000 | $142,100 |
| 2014 | $1,435 | $186,100 | $44,000 | $142,100 |
Source: Public Records
Map
Nearby Homes
Your Personal Tour Guide
Ask me questions while you tour the home.