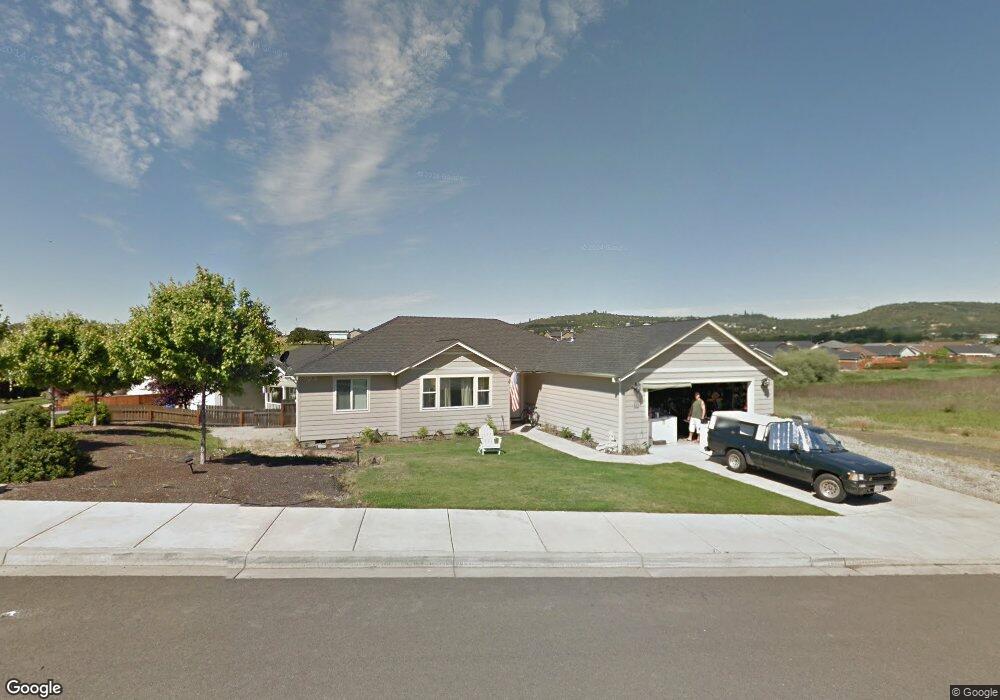
111 Westbrook Way Eagle Point, OR 97524
Estimated Value: $416,898 - $421,000
3
Beds
2
Baths
1,582
Sq Ft
$264/Sq Ft
Est. Value
About This Home
This home is located at 111 Westbrook Way, Eagle Point, OR 97524 and is currently estimated at $418,225, approximately $264 per square foot. 111 Westbrook Way is a home located in Jackson County with nearby schools including Eagle Rock Elementary School, Eagle Point Middle School, and White Mountain Middle School.
Ownership History
Date
Name
Owned For
Owner Type
Purchase Details
Closed on
Jul 25, 2007
Sold by
Smith Alicia M
Bought by
Smith B Scott
Current Estimated Value
Purchase Details
Closed on
Nov 28, 2005
Sold by
Harris Kenneth M and Harris Deborah S
Bought by
Smith B Scott and Smith Alicia M
Home Financials for this Owner
Home Financials are based on the most recent Mortgage that was taken out on this home.
Original Mortgage
$206,000
Interest Rate
6.75%
Mortgage Type
Fannie Mae Freddie Mac
Purchase Details
Closed on
Jun 24, 2005
Sold by
Johnson James K
Bought by
Harris Kenneth M and Harris Deborah S
Home Financials for this Owner
Home Financials are based on the most recent Mortgage that was taken out on this home.
Original Mortgage
$204,642
Interest Rate
5.72%
Mortgage Type
Construction
Create a Home Valuation Report for This Property
The Home Valuation Report is an in-depth analysis detailing your home's value as well as a comparison with similar homes in the area
Home Values in the Area
Average Home Value in this Area
Purchase History
| Date | Buyer | Sale Price | Title Company |
|---|---|---|---|
| Smith B Scott | -- | None Available | |
| Smith B Scott | -- | Amerititle | |
| Harris Kenneth M | $89,500 | Amerititle |
Source: Public Records
Mortgage History
| Date | Status | Borrower | Loan Amount |
|---|---|---|---|
| Previous Owner | Smith B Scott | $206,000 | |
| Previous Owner | Harris Kenneth M | $204,642 |
Source: Public Records
Tax History
| Year | Tax Paid | Tax Assessment Tax Assessment Total Assessment is a certain percentage of the fair market value that is determined by local assessors to be the total taxable value of land and additions on the property. | Land | Improvement |
|---|---|---|---|---|
| 2026 | $3,105 | $228,220 | -- | -- |
| 2025 | $3,032 | $221,580 | $89,890 | $131,690 |
| 2024 | $3,032 | $215,130 | $87,270 | $127,860 |
| 2023 | $2,929 | $208,870 | $84,720 | $124,150 |
| 2022 | $2,849 | $208,870 | $84,720 | $124,150 |
| 2021 | $2,765 | $202,790 | $82,260 | $120,530 |
| 2020 | $2,937 | $196,890 | $79,870 | $117,020 |
| 2019 | $2,893 | $185,600 | $75,290 | $110,310 |
| 2018 | $2,838 | $180,200 | $73,090 | $107,110 |
| 2017 | $2,768 | $180,200 | $73,090 | $107,110 |
| 2016 | $2,714 | $169,870 | $68,900 | $100,970 |
| 2015 | $2,625 | $169,870 | $68,900 | $100,970 |
| 2014 | $2,550 | $160,130 | $64,940 | $95,190 |
Source: Public Records
Map
Nearby Homes
- 1023 Highlands Dr
- 208 Northview Dr Unit 1B
- 911 Stonewater Dr
- 912 Stonewater Dr
- 925 Sellwood Dr
- 917 Stonewater Dr
- 945 Win Way
- 545 N Heights Dr
- 110 Linton Way
- 1017 Havenwood Dr
- 403 N Deanjou Ave
- 407 N Deanjou Ave
- 438 Westminster Dr
- 468 Merlee Cir
- 631 Nottingham Terrace
- 700 Nottingham Terrace
- 712 Nottingham Terrace
- 250 Tierra Cir
- 417 E Rolling Hills Dr
- 124 Paxon Ave
- 1126 Highlands Dr
- 114 Westbrook Way
- 1132 Highlands Dr
- 1115 Highlands Dr
- 1137 Highlands Dr
- 1106 Highlands Dr
- 1113 Highlands Dr
- 1138 Highlands Dr
- 1153 Highlands Dr
- 1100 Highlands Dr
- 1144 Highlands Dr
- 1097 Highlands Dr
- 1150 Highlands Dr
- 1159 Highlands Dr
- 1094 Highlands Dr
- 1089 Highlands Dr
- 1086 Highlands Dr
- 1165 Highlands Dr
- 1162 Highlands Dr
- 1053 Highlands Dr
Your Personal Tour Guide
Ask me questions while you tour the home.