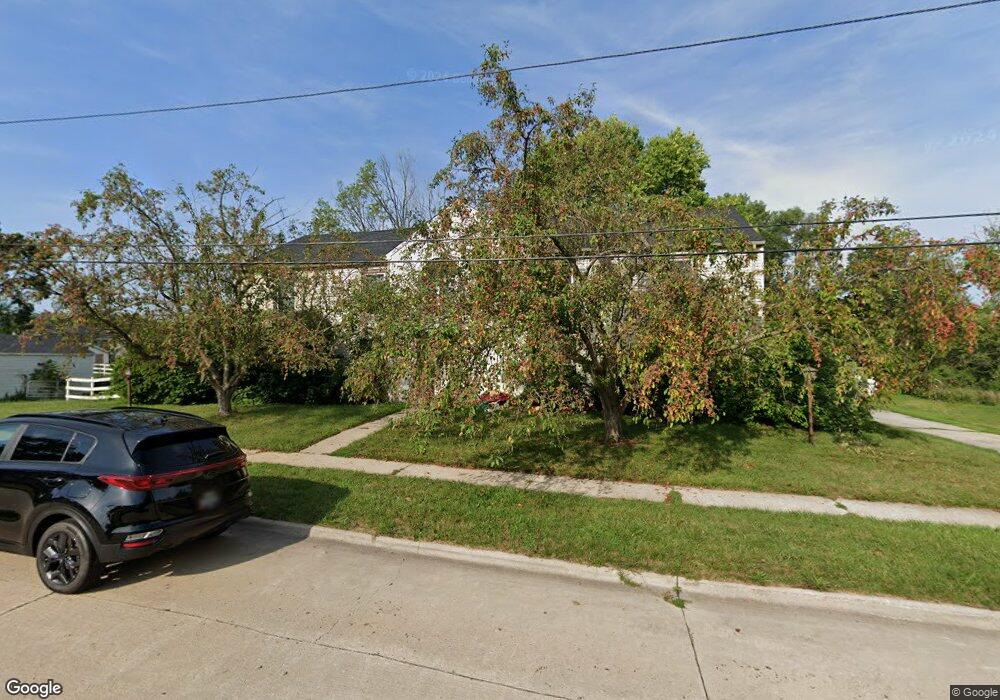
1110 3rd St Unit 3 Marion, IA 52302
Estimated Value: $118,466 - $275,000
2
Beds
1
Bath
918
Sq Ft
$193/Sq Ft
Est. Value
About This Home
This home is located at 1110 3rd St Unit 3, Marion, IA 52302 and is currently estimated at $177,367, approximately $193 per square foot. 1110 3rd St Unit 3 is a home located in Linn County with nearby schools including Longfellow Elementary, Francis Marion Intermediate School, and Vernon Middle School.
Ownership History
Date
Name
Owned For
Owner Type
Purchase Details
Closed on
Jun 12, 2025
Sold by
Larsen Investment Llc
Bought by
B & Z Property Management Llc
Current Estimated Value
Home Financials for this Owner
Home Financials are based on the most recent Mortgage that was taken out on this home.
Original Mortgage
$270,000
Outstanding Balance
$268,948
Interest Rate
6.76%
Mortgage Type
New Conventional
Estimated Equity
-$91,581
Purchase Details
Closed on
Jan 17, 2022
Sold by
Larsen Thomas H
Bought by
Larsen Investment Llc
Purchase Details
Closed on
Jun 23, 2015
Sold by
Kenmar Properties Llc
Bought by
Siegel & Handley Rentals Llc
Home Financials for this Owner
Home Financials are based on the most recent Mortgage that was taken out on this home.
Original Mortgage
$123,205
Interest Rate
3.82%
Mortgage Type
Future Advance Clause Open End Mortgage
Create a Home Valuation Report for This Property
The Home Valuation Report is an in-depth analysis detailing your home's value as well as a comparison with similar homes in the area
Home Values in the Area
Average Home Value in this Area
Purchase History
| Date | Buyer | Sale Price | Title Company |
|---|---|---|---|
| B & Z Property Management Llc | $286,500 | None Listed On Document | |
| Larsen Investment Llc | -- | None Listed On Document | |
| Siegel & Handley Rentals Llc | $140,000 | None Available |
Source: Public Records
Mortgage History
| Date | Status | Borrower | Loan Amount |
|---|---|---|---|
| Open | B & Z Property Management Llc | $270,000 | |
| Previous Owner | Siegel & Handley Rentals Llc | $123,205 |
Source: Public Records
Tax History
| Year | Tax Paid | Tax Assessment Tax Assessment Total Assessment is a certain percentage of the fair market value that is determined by local assessors to be the total taxable value of land and additions on the property. | Land | Improvement |
|---|---|---|---|---|
| 2025 | $1,080 | $72,900 | $7,100 | $65,800 |
| 2024 | $1,032 | $57,600 | $7,100 | $50,500 |
| 2023 | $1,032 | $57,600 | $7,100 | $50,500 |
| 2022 | $998 | $46,400 | $7,100 | $39,300 |
| 2021 | $974 | $46,400 | $7,100 | $39,300 |
| 2020 | $974 | $43,100 | $7,100 | $36,000 |
| 2019 | $908 | $43,100 | $7,100 | $36,000 |
| 2018 | $888 | $40,300 | $7,100 | $33,200 |
| 2017 | $842 | $37,800 | $7,100 | $30,700 |
| 2016 | $842 | $37,800 | $7,100 | $30,700 |
| 2015 | $838 | $37,800 | $7,100 | $30,700 |
| 2014 | $838 | $37,800 | $7,100 | $30,700 |
| 2013 | -- | $37,800 | $7,100 | $30,700 |
Source: Public Records
Map
Nearby Homes
Your Personal Tour Guide
Ask me questions while you tour the home.