Estimated Value: $229,000 - $238,852
3
Beds
2
Baths
1,415
Sq Ft
$165/Sq Ft
Est. Value
About This Home
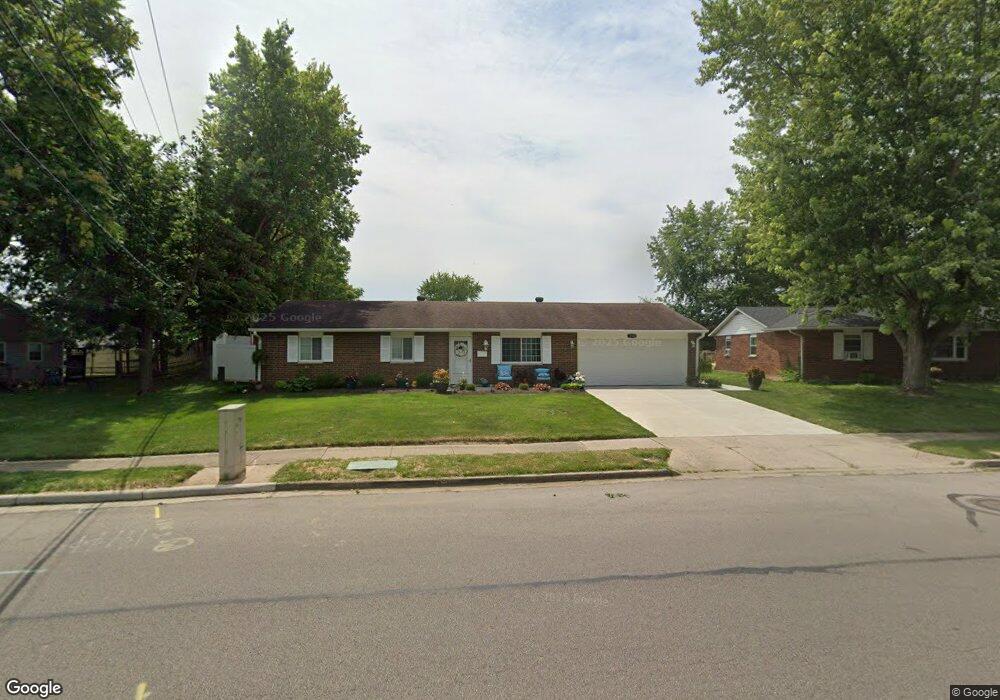
This home is located at 1110 Colorado Dr, Xenia, OH 45385 and is currently estimated at $233,463, approximately $164 per square foot. 1110 Colorado Dr is a home located in Greene County with nearby schools including Xenia High School, Summit Academy Community School for Alternative Learners - Xenia, and Legacy Christian Academy.
Ownership History
Date
Name
Owned For
Owner Type
Purchase Details
Closed on
Nov 17, 2021
Sold by
Greentree Llc
Bought by
Caudill Benjamin F and Caudill Neva
Current Estimated Value
Purchase Details
Closed on
Jun 4, 2020
Sold by
Venture Real Estate Group Llc
Bought by
Properties By Greentree Llc
Purchase Details
Closed on
May 1, 2020
Sold by
Holiman Kathryn M and Peace Kathryn M
Bought by
Venture Real Estate Group Llc
Purchase Details
Closed on
Jul 2, 1999
Sold by
Peace William E
Bought by
Peace Kathryn M
Purchase Details
Closed on
Oct 19, 1990
Bought by
Peace Kathryn M
Create a Home Valuation Report for This Property
The Home Valuation Report is an in-depth analysis detailing your home's value as well as a comparison with similar homes in the area
Home Values in the Area
Average Home Value in this Area
Purchase History
| Date | Buyer | Sale Price | Title Company |
|---|---|---|---|
| Caudill Benjamin F | $186,000 | None Available | |
| Properties By Greentree Llc | $75,000 | Republic Title Agency Inc | |
| Venture Real Estate Group Llc | $57,000 | Republic Title Agency Inc | |
| Peace Kathryn M | -- | -- | |
| Peace Kathryn M | $69,500 | -- |
Source: Public Records
Tax History Compared to Growth
Tax History
| Year | Tax Paid | Tax Assessment Tax Assessment Total Assessment is a certain percentage of the fair market value that is determined by local assessors to be the total taxable value of land and additions on the property. | Land | Improvement |
|---|---|---|---|---|
| 2024 | $2,312 | $65,230 | $14,440 | $50,790 |
| 2023 | $2,312 | $65,230 | $14,440 | $50,790 |
| 2022 | $1,848 | $46,520 | $8,490 | $38,030 |
| 2021 | $2,067 | $39,880 | $7,720 | $32,160 |
| 2020 | $2,082 | $39,880 | $7,720 | $32,160 |
| 2019 | $1,748 | $34,680 | $7,580 | $27,100 |
| 2018 | $1,754 | $34,680 | $7,580 | $27,100 |
| 2017 | $1,611 | $34,680 | $7,580 | $27,100 |
| 2016 | $1,611 | $31,250 | $7,580 | $23,670 |
| 2015 | $1,616 | $31,250 | $7,580 | $23,670 |
| 2014 | $1,546 | $31,250 | $7,580 | $23,670 |
Source: Public Records
Map
Nearby Homes
- 1107 Arkansas Dr
- 1255 Colorado Dr
- 1908 Whitt St
- 2499 Jenny Marie Dr
- 2345 Tennessee Dr
- 1829 Gayhart Dr
- 1866 Roxbury Dr
- 2421 Louisiana Dr
- 2540 Jenny Marie Dr
- 1769 Gayhart Dr
- 2257 Maryland Dr
- 1403 Texas Dr
- 2540 Cornwall Dr
- 0 Berkshire Dr Unit 942854
- 2142 Michigan Dr
- 1778 Arapaho Dr
- 2545 Harmony Dr
- 2692 Kingman Dr
- 1653 Seneca Dr
- 2705 Tennessee Dr
- 1096 Colorado Dr
- 1170 Colorado Dr
- 1093 Arkansas Dr
- 2160 Cornwall Dr
- 1079 Arkansas Dr
- 1080 Colorado Dr
- 1119 Arkansas Dr
- 2144 Cornwall Dr
- 2172 Cornwall Dr
- 1167 Colorado Dr
- 1063 Arkansas Dr
- 1171 Colorado Dr
- 1057 Colorado Dr
- 1133 Arkansas Dr
- 1193 Colorado Dr
- 2186 Cornwall Dr
- 1112 Arkansas Dr
- 1094 Arkansas Dr
- 1209 Colorado Dr
- 1043 Colorado Dr