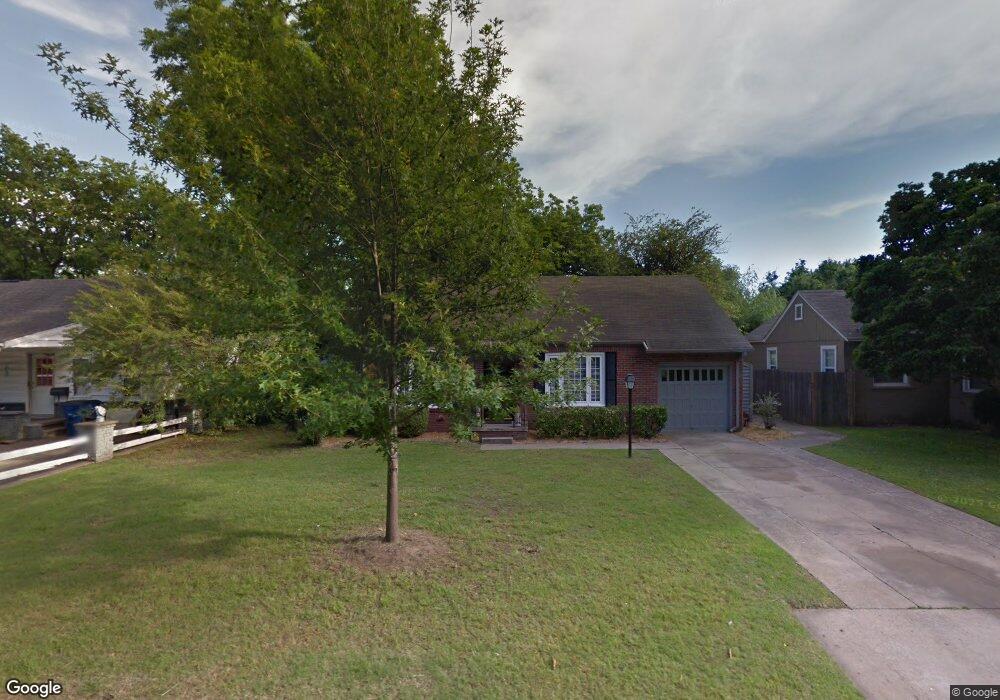
1110 E 33rd Place Tulsa, OK 74105
Brookside NeighborhoodEstimated Value: $242,933 - $317,000
2
Beds
1
Bath
1,010
Sq Ft
$284/Sq Ft
Est. Value
About This Home
This home is located at 1110 E 33rd Place, Tulsa, OK 74105 and is currently estimated at $286,983, approximately $284 per square foot. 1110 E 33rd Place is a home located in Tulsa County with nearby schools including Eliot Elementary School, Edison Preparatory School, and Thomas Edison Preparatory High School.
Ownership History
Date
Name
Owned For
Owner Type
Purchase Details
Closed on
Oct 2, 2012
Sold by
Mitchell Pamela Lee
Bought by
Disler Richard Corey and Disler Theresa Masrie
Current Estimated Value
Home Financials for this Owner
Home Financials are based on the most recent Mortgage that was taken out on this home.
Original Mortgage
$110,000
Interest Rate
3.7%
Mortgage Type
New Conventional
Purchase Details
Closed on
Mar 31, 2008
Sold by
Gray Megan E
Bought by
Mitchell Pamela Lee
Home Financials for this Owner
Home Financials are based on the most recent Mortgage that was taken out on this home.
Original Mortgage
$92,400
Interest Rate
6.19%
Mortgage Type
Unknown
Purchase Details
Closed on
Aug 22, 2000
Sold by
Littlefield Roger P and Littlefield Kasey L
Bought by
Littlefield Roger P and Littlefield Kassey L
Purchase Details
Closed on
Aug 1, 1992
Create a Home Valuation Report for This Property
The Home Valuation Report is an in-depth analysis detailing your home's value as well as a comparison with similar homes in the area
Home Values in the Area
Average Home Value in this Area
Purchase History
| Date | Buyer | Sale Price | Title Company |
|---|---|---|---|
| Disler Richard Corey | $137,500 | Firstitle & Abstract Service | |
| Mitchell Pamela Lee | $132,000 | First American Title & Abstr | |
| Littlefield Roger P | -- | -- | |
| -- | $53,000 | -- |
Source: Public Records
Mortgage History
| Date | Status | Borrower | Loan Amount |
|---|---|---|---|
| Closed | Disler Richard Corey | $110,000 | |
| Previous Owner | Mitchell Pamela Lee | $92,400 |
Source: Public Records
Tax History
| Year | Tax Paid | Tax Assessment Tax Assessment Total Assessment is a certain percentage of the fair market value that is determined by local assessors to be the total taxable value of land and additions on the property. | Land | Improvement |
|---|---|---|---|---|
| 2025 | $2,810 | $20,972 | $4,282 | $16,690 |
| 2024 | $2,414 | $19,974 | $4,728 | $15,246 |
| 2023 | $2,414 | $19,022 | $4,029 | $14,993 |
| 2022 | $2,415 | $18,116 | $5,089 | $13,027 |
| 2021 | $2,279 | $17,254 | $4,847 | $12,407 |
| 2020 | $2,248 | $17,254 | $4,847 | $12,407 |
| 2019 | $2,364 | $17,254 | $4,847 | $12,407 |
| 2018 | $2,290 | $16,675 | $4,684 | $11,991 |
| 2017 | $2,177 | $15,881 | $4,461 | $11,420 |
| 2016 | $2,031 | $15,125 | $4,488 | $10,637 |
| 2015 | $2,034 | $15,125 | $4,488 | $10,637 |
| 2014 | $2,015 | $15,125 | $4,488 | $10,637 |
Source: Public Records
Map
Nearby Homes
- 1104 E 35th Place
- 227 E 35th St
- 211 E 34th St
- 1031 E 36th St
- 227 E 35th Place
- 1242 E 31st Ct
- 129 E 34th St
- 1004 E 36th St
- 1411 E 35th St
- 3405 Riverside Dr
- 3409 Riverside Dr
- 3155 S Rockford Dr
- 3015 S Madison Ave
- 3704 S Madison Ave Unit 3704
- 1260 E 30th St
- 1516 E 33rd St
- 913 E 37th St
- 3758 S Madison Ave Unit 5
- 3701 Riverside Dr Unit 14
- 3701 Riverside Dr Unit 6
- 1114 E 33rd Place
- 1104 E 33rd Place
- 1107 E 34th St
- 1052 E 33rd Place
- 1105 E 34th St
- 1115 E 34th St
- 1124 E 33rd Place
- 1111 E 33rd Place
- 1101 E 34th St
- 1119 E 34th St
- 1103 E 33rd Place
- 1115 E 33rd Place
- 1119 E 33rd Place
- 1049 E 33rd Place
- 1123 E 34th St
- 1045 E 34th St
- 1040 E 33rd Place
- 1123 E 33rd Place
- 1043 E 33rd Place
- 1037 E 34th St
Your Personal Tour Guide
Ask me questions while you tour the home.