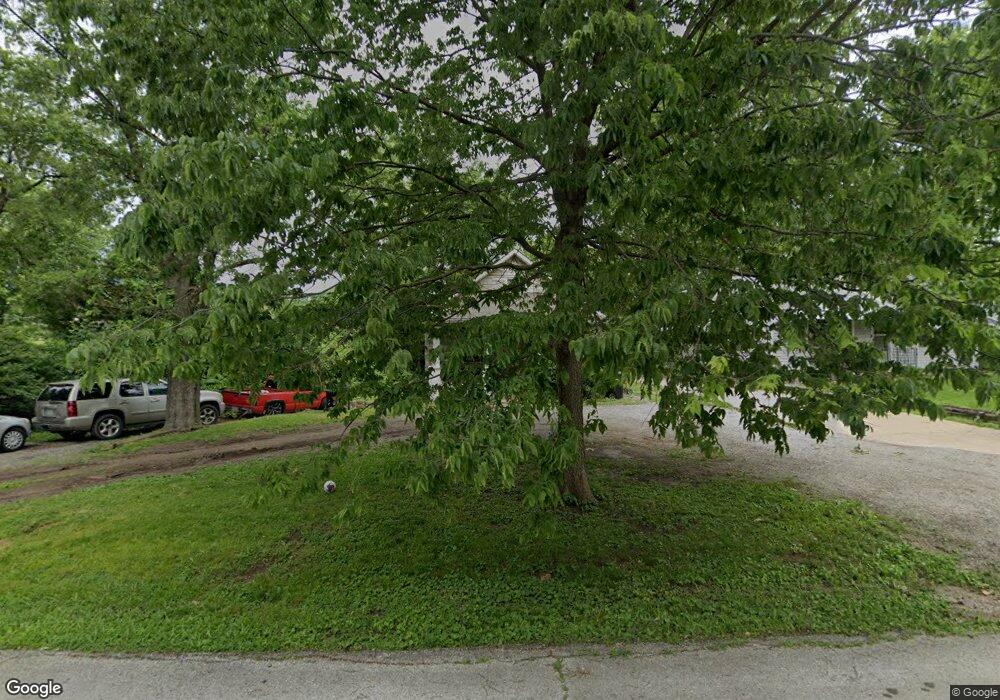
1110 E Gudgell Ave Independence, MO 64055
Hanthorn NeighborhoodEstimated Value: $151,015 - $186,000
3
Beds
1
Bath
1,092
Sq Ft
$151/Sq Ft
Est. Value
About This Home
This home is located at 1110 E Gudgell Ave, Independence, MO 64055 and is currently estimated at $165,254, approximately $151 per square foot. 1110 E Gudgell Ave is a home located in Jackson County with nearby schools including Sycamore Hills Elementary School, Bridger Middle School, and Pioneer Ridge Middle School.
Ownership History
Date
Name
Owned For
Owner Type
Purchase Details
Closed on
May 29, 2020
Sold by
Kansas City Re Investment Svcs Llc
Bought by
Day Robert A and Day Rachelle R
Current Estimated Value
Home Financials for this Owner
Home Financials are based on the most recent Mortgage that was taken out on this home.
Original Mortgage
$101,600
Outstanding Balance
$89,861
Interest Rate
3.2%
Mortgage Type
New Conventional
Estimated Equity
$75,393
Purchase Details
Closed on
Feb 4, 2020
Sold by
Sabla Tawfiq A and Sabla Tawfiq
Bought by
Kansas City Re Investment Svcs Llc
Purchase Details
Closed on
Jul 30, 2009
Sold by
Daniels Donald and Daniels Judith
Bought by
Sabla Tawfiq A
Home Financials for this Owner
Home Financials are based on the most recent Mortgage that was taken out on this home.
Original Mortgage
$66,276
Interest Rate
5.44%
Mortgage Type
FHA
Purchase Details
Closed on
Jan 22, 2009
Sold by
George Bobby Joe
Bought by
Daniels Donald and Daniels Judith
Create a Home Valuation Report for This Property
The Home Valuation Report is an in-depth analysis detailing your home's value as well as a comparison with similar homes in the area
Home Values in the Area
Average Home Value in this Area
Purchase History
| Date | Buyer | Sale Price | Title Company |
|---|---|---|---|
| Day Robert A | -- | None Available | |
| Kansas City Re Investment Svcs Llc | $67,000 | None Available | |
| Sabla Tawfiq A | -- | Kansas City Title | |
| Daniels Donald | -- | Old Republic Title Company |
Source: Public Records
Mortgage History
| Date | Status | Borrower | Loan Amount |
|---|---|---|---|
| Open | Day Robert A | $101,600 | |
| Previous Owner | Sabla Tawfiq A | $66,276 |
Source: Public Records
Tax History
| Year | Tax Paid | Tax Assessment Tax Assessment Total Assessment is a certain percentage of the fair market value that is determined by local assessors to be the total taxable value of land and additions on the property. | Land | Improvement |
|---|---|---|---|---|
| 2025 | $1,891 | $17,839 | $5,369 | $12,470 |
| 2024 | $1,848 | $27,290 | $5,216 | $22,074 |
| 2023 | $1,848 | $27,289 | $3,262 | $24,027 |
| 2022 | $996 | $13,490 | $3,281 | $10,209 |
| 2021 | $996 | $13,490 | $3,281 | $10,209 |
| 2020 | $1,024 | $13,476 | $3,281 | $10,195 |
| 2019 | $1,008 | $13,476 | $3,281 | $10,195 |
| 2018 | $919 | $11,729 | $2,856 | $8,873 |
| 2017 | $919 | $11,729 | $2,856 | $8,873 |
| 2016 | $807 | $10,199 | $3,131 | $7,068 |
Source: Public Records
Map
Nearby Homes
- 1702 S Pollard Ave
- 2705 S Haden Ct
- 2800 S Woodbury Dr
- 2724 S Woodbury Dr
- 15804 E 27th St S
- 921 E Manor Rd
- 2705 S Breckenridge Dr
- 735 E Devon St
- 2724 Queen Ridge Dr
- 660 E Red Rd
- 1954 S Lake Terrace
- 1109 S Woodbury St
- 603 E Myrtle St
- 1124 S Haden St
- 1040 E Stone St
- 1340 S Emery Ave
- 421 E Angus St
- 1339 S Hocker Ave
- 16403 E Ellison Way
- 1530 S Pearl St
- 1118 E Gudgell Ave
- 1130 E Gudgell Ave
- 1132 E Gudgell Ave
- 1106 E Gudgell Ave
- 1129 E Gudgell Ave
- 1109 E Gudgell Ave
- 1131 E Gudgell Ave
- 1104 E Gudgell Ave
- 1133 E Gudgell Ave
- 1134 E Gudgell Ave
- 1105 E Gudgell Ave
- 1136 E Gudgell Ave
- 1135 E Gudgell Ave
- 1101 E Gudgell Ave
- 1615 S Pollard Ave
- 1011 E Gudgell Ave
- 1011 E Gudgell Ave
- 1617 S Pollard Ave
- 1702 S Hands St
- 1608 S Pollard Ave
Your Personal Tour Guide
Ask me questions while you tour the home.