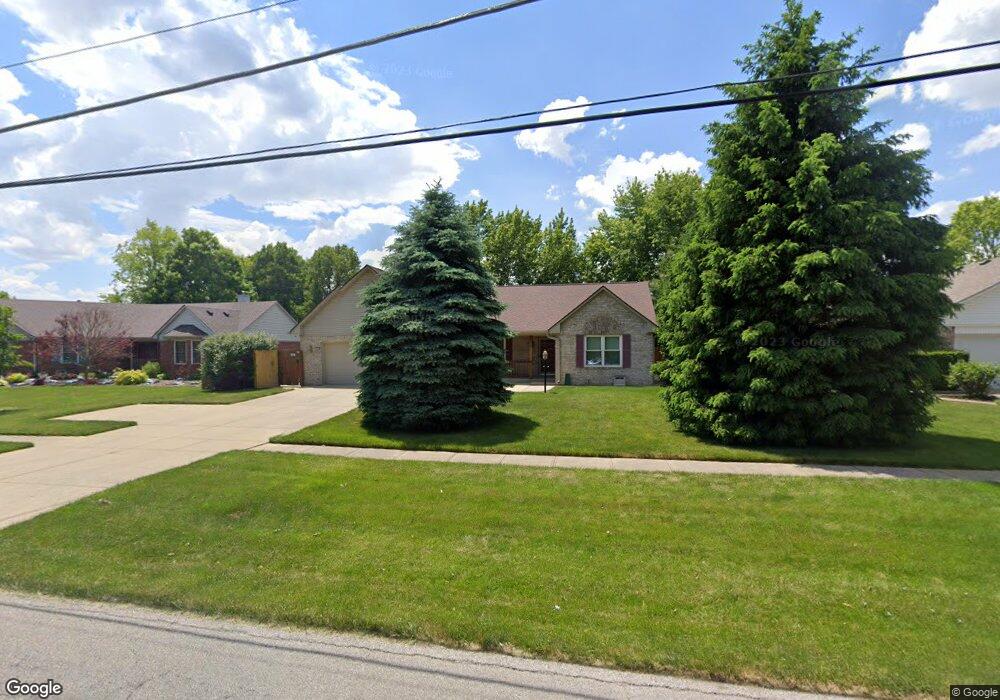
1110 John-Bart Rd Lebanon, IN 46052
Estimated Value: $345,000 - $437,000
4
Beds
2
Baths
2,125
Sq Ft
$175/Sq Ft
Est. Value
About This Home
This home is located at 1110 John-Bart Rd, Lebanon, IN 46052 and is currently estimated at $371,043, approximately $174 per square foot. 1110 John-Bart Rd is a home located in Boone County with nearby schools including Central Elementary School, Lebanon Middle School, and Lebanon Senior High School.
Ownership History
Date
Name
Owned For
Owner Type
Purchase Details
Closed on
Jul 25, 2012
Sold by
Kent Stephen A and Kent Dana H
Bought by
Kent Stephen A and Kent Dana H
Current Estimated Value
Home Financials for this Owner
Home Financials are based on the most recent Mortgage that was taken out on this home.
Original Mortgage
$141,339
Outstanding Balance
$97,034
Interest Rate
3.48%
Mortgage Type
New Conventional
Estimated Equity
$274,009
Purchase Details
Closed on
Dec 20, 2011
Sold by
Kent Stephen A and Kent Dana H
Bought by
Kent Stephen A and Kent Dana H
Purchase Details
Closed on
Mar 23, 2011
Sold by
Glibert Darlene C and Sieg Darlene C
Bought by
Kent Stephen A and Kent Dana H
Home Financials for this Owner
Home Financials are based on the most recent Mortgage that was taken out on this home.
Original Mortgage
$135,653
Interest Rate
5.09%
Mortgage Type
New Conventional
Create a Home Valuation Report for This Property
The Home Valuation Report is an in-depth analysis detailing your home's value as well as a comparison with similar homes in the area
Home Values in the Area
Average Home Value in this Area
Purchase History
| Date | Buyer | Sale Price | Title Company |
|---|---|---|---|
| Kent Stephen A | -- | Nations Title | |
| Kent Stephen A | -- | None Available | |
| Kent Stephen A | -- | -- |
Source: Public Records
Mortgage History
| Date | Status | Borrower | Loan Amount |
|---|---|---|---|
| Open | Kent Stephen A | $141,339 | |
| Previous Owner | Kent Stephen A | $135,653 |
Source: Public Records
Tax History Compared to Growth
Tax History
| Year | Tax Paid | Tax Assessment Tax Assessment Total Assessment is a certain percentage of the fair market value that is determined by local assessors to be the total taxable value of land and additions on the property. | Land | Improvement |
|---|---|---|---|---|
| 2024 | $4,113 | $313,500 | $31,200 | $282,300 |
| 2023 | $2,236 | $268,600 | $31,200 | $237,400 |
| 2022 | $2,414 | $268,600 | $31,200 | $237,400 |
| 2021 | $1,933 | $226,100 | $31,200 | $194,900 |
| 2020 | $1,697 | $209,300 | $31,200 | $178,100 |
| 2019 | $1,610 | $208,100 | $31,200 | $176,900 |
| 2018 | $1,717 | $221,100 | $31,200 | $189,900 |
| 2017 | $1,555 | $198,700 | $31,200 | $167,500 |
| 2016 | $1,635 | $199,200 | $31,200 | $168,000 |
| 2014 | $1,357 | $178,600 | $31,200 | $147,400 |
| 2013 | $1,263 | $175,400 | $31,200 | $144,200 |
Source: Public Records
Map
Nearby Homes
- 1116 Sunnyside Ln
- Breckenridge Plan at Cedar Ridge - Maple Street Collection
- Jensen Plan at Cedar Ridge - Maple Street Collection
- Yosemite Plan at Cedar Ridge - Maple Street Collection
- Fairfax Plan at Cedar Ridge - Maple Street Collection
- Cumberland Plan at Cedar Ridge - Maple Street Collection
- DaVinci Plan at Cedar Ridge - Maple Street Collection
- Greenbriar Plan at Cedar Ridge - Maple Street Collection
- Beacon Plan at Cedar Ridge - Maple Street Collection
- Wesley Plan at Cedar Ridge - Maple Street Collection
- 425 Atlas Dr
- 1000 Deodar St
- 420 Atlas Dr
- 523 N Grant St
- 402 Glendale Dr
- 514 E Washington St
- 1903 Elizaville Rd
- 422 E Main St
- 1919 Elizaville Rd
- 708 E Elm St
- 1110 John Bart Rd
- 1114 John Bart Rd
- 1106 John Bart Rd
- 1133 Brookside Dr
- 1137 Brookside Dr
- 1118 John-Bart Rd
- 1118 John Bart Rd
- 1129 Brookside Dr
- 1095 John Bart Rd
- 1102 John Bart Rd
- 1141 Brookside Dr
- 1125 John Bart Rd
- 1127 Brookside Dr
- 1407 Morningside Dr
- 1145 John Bart Rd
- 1134 Brookside Dr
- 1403 Morningside Dr
- 1138 Brookside Dr
- 1125 Brookside Dr
- 1040 John Bart Rd