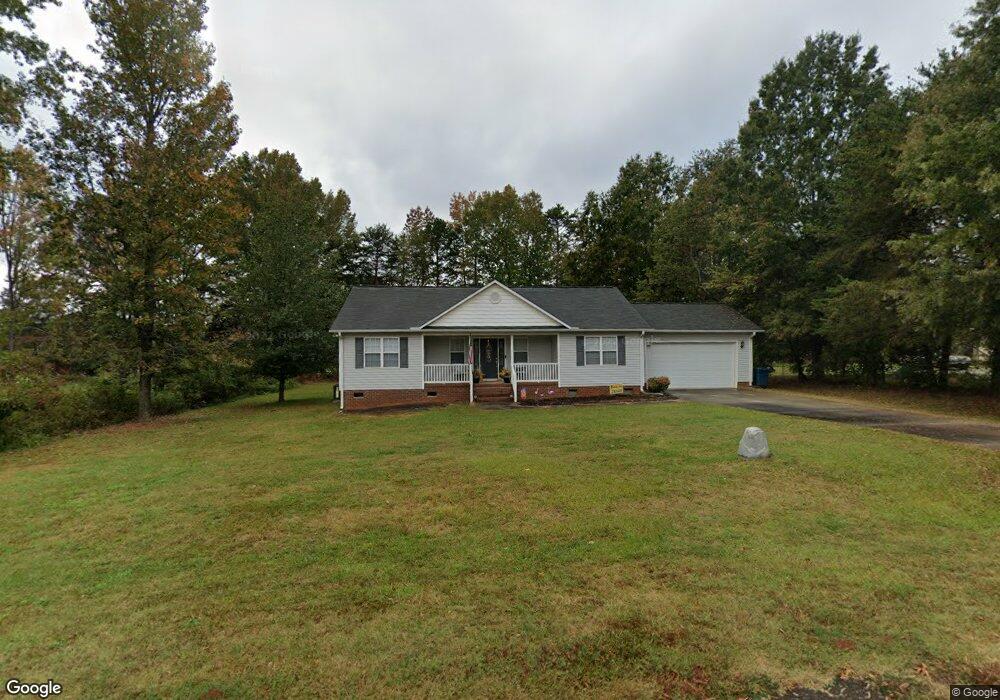
1110 Joy St Salisbury, NC 28147
Estimated Value: $277,062 - $318,000
Studio
2
Baths
1,364
Sq Ft
$222/Sq Ft
Est. Value
About This Home
This home is located at 1110 Joy St, Salisbury, NC 28147 and is currently estimated at $302,516, approximately $221 per square foot. 1110 Joy St is a home located in Rowan County with nearby schools including Knollwood Elementary School, Southeast Middle School, and West Rowan High School.
Ownership History
Date
Name
Owned For
Owner Type
Purchase Details
Closed on
Mar 13, 2017
Sold by
Blaney Joseph W
Bought by
Blaney Joseph W and Blaney Kimberly
Current Estimated Value
Purchase Details
Closed on
Nov 30, 2006
Sold by
Knight Graham F and Knight Wanda T
Bought by
Blaney Joseph W
Home Financials for this Owner
Home Financials are based on the most recent Mortgage that was taken out on this home.
Original Mortgage
$99,900
Outstanding Balance
$59,794
Interest Rate
6.33%
Mortgage Type
Purchase Money Mortgage
Estimated Equity
$242,722
Purchase Details
Closed on
May 26, 2006
Sold by
Goodman Greer N
Bought by
Knight Graham F and Knight Wanda T
Home Financials for this Owner
Home Financials are based on the most recent Mortgage that was taken out on this home.
Original Mortgage
$17,600
Interest Rate
6.41%
Mortgage Type
Purchase Money Mortgage
Create a Home Valuation Report for This Property
The Home Valuation Report is an in-depth analysis detailing your home's value as well as a comparison with similar homes in the area
Purchase History
| Date | Buyer | Sale Price | Title Company |
|---|---|---|---|
| Blaney Joseph W | -- | None Available | |
| Blaney Joseph W | $125,000 | None Available | |
| Knight Graham F | $22,000 | None Available |
Source: Public Records
Mortgage History
| Date | Status | Borrower | Loan Amount |
|---|---|---|---|
| Open | Blaney Joseph W | $99,900 | |
| Previous Owner | Knight Graham F | $17,600 |
Source: Public Records
Tax History
| Year | Tax Paid | Tax Assessment Tax Assessment Total Assessment is a certain percentage of the fair market value that is determined by local assessors to be the total taxable value of land and additions on the property. | Land | Improvement |
|---|---|---|---|---|
| 2025 | $1,425 | $210,374 | $30,000 | $180,374 |
| 2024 | $1,425 | $210,374 | $30,000 | $180,374 |
| 2023 | $1,425 | $210,374 | $30,000 | $180,374 |
| 2022 | $1,023 | $135,476 | $21,500 | $113,976 |
| 2021 | $1,013 | $135,476 | $21,500 | $113,976 |
| 2020 | $1,013 | $135,476 | $21,500 | $113,976 |
| 2019 | $1,013 | $135,476 | $21,500 | $113,976 |
| 2018 | $868 | $117,161 | $21,500 | $95,661 |
| 2017 | $868 | $117,161 | $21,500 | $95,661 |
| 2016 | $868 | $117,161 | $21,500 | $95,661 |
| 2015 | $879 | $117,161 | $21,500 | $95,661 |
| 2014 | $842 | $117,731 | $21,500 | $96,231 |
Source: Public Records
Map
Nearby Homes
- 1300 Briarwood Terrace
- 2885 Wright Ave
- 206 Cedar Dr
- 1250 Edgewood Ct
- 114 Cedar Dr
- 4710 Mooresville Rd
- 112 Cedar Dr
- 4712 Mooresville Rd
- 540 Roger Dr
- 225 Roger Dr
- 140 Overbrook Rd
- 215 Autumn Chapel Dr
- 335 Bonaventure Dr
- 325 Bonaventure Dr
- 1348 Greenheather Dr
- 170 Heritage Ln
- 240 Partridge Run
- 245 Spicewood Ln Unit 25
- 202 Bayberry Dr
- 1015 Quail Cir
- 1120 Joy St
- 1115 Joy St
- 1135 Joy St
- 2625 Airport Rd
- 2610 Airport Rd
- 2615 Airport Rd
- 2645 Airport Rd
- 1139 Joy St
- 2620 Jonathan St
- 2610 Jonathan St
- 140 Lane St
- 0 Miller Chapel Rd
- 000 Miller Chapel Rd
- 2630 Jonathan St
- 2649 Airport Rd
- 2650 Airport Rd
- 2629 Airport Rd
- 1145 Joy St
- 180 Lane St
- 2580 Airport Rd
Your Personal Tour Guide
Ask me questions while you tour the home.