NOT LISTED FOR SALE

1110 N Albany St Grandview, IL 62702

Estimated Value: $76,000 - $114,000

-- Bed
-- Bath
4,525 Sq Ft
$21/Sq Ft Est. Value

Last Sold May 22, 2012

Last sale price $55,000 $12 Per Sq Ft

Est. 71% increase in value since last sale

Current estimated payment $715/month

96 Days on Market

About This Home

As of May 2012

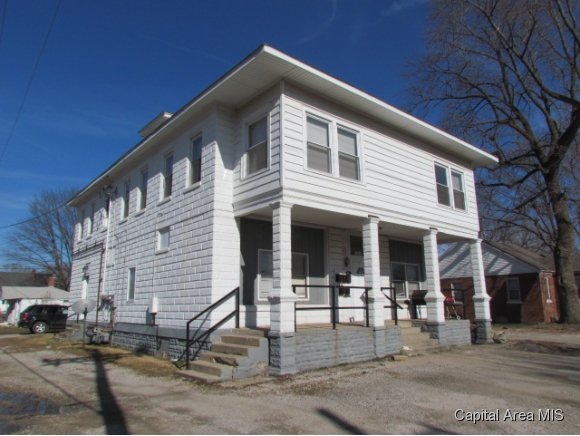
Fantastic income property in Grandview! 5 Unit apartment building + 2 houses. Address for 5plex is 2201 Cincinnati. Newer central air in 3 of the units. Verification of all MLS information and property condition is buyers responsibility. Sold "As Is". Bring Offers - possible package deal with other Springfield properties.

Last Agent to Sell the Property

Joe Tetzlaff

RE/MAX Professionals License #471000757 Listed on: 02/02/2012

RE/MAX Professionals

Last Buyer's Agent

Matthew Holcomb

IN BETWEEN OFFICES License #475142478

Property Details

Home Type

  • Multi-Family

Est. Annual Taxes

  • $2,592

Lot Details

  • 9,278

Basement

  • Basement Fills Entire Space Under The House

Schools

  • Springfield District #186 High School

Property Details

Home Type

Multi-Family

Est. Annual Taxes

$2,592

Lot Details

0

Listing Details

  • Class: Multi-Family
  • Type: Residential Income
  • Style: Apartment Building
  • Legal Description: VILLAGE OF GRANDVIEW WANLESS N GRAND PL ADDN W 60 L 71
  • Special Features: None
  • Property Sub Type: MultiFamily

Interior Features

  • Basement: Full, Brick, Concrete, Stone
  • Price Per Sq Ft: 12.15
  • Total Sq Ft: 4525

Exterior Features

  • Exterior: Vinyl Siding

Garage/Parking

  • Garage Parking: On-Street Parking
  • Number Parking Spaces: 14

Utilities

  • Heating Cooling: Forced Air, Gas, Central Air
  • Water Sewer: Public Sewer, Public Water

Schools

  • High School: Springfield District #186
  • High School: Springfield District #186

Lot Info

  • Estimated Lot Size: 60x155
  • Zoning: R
  • Geo Subdivision: IL

Tax Info

  • Annual Taxes: 2592
  • Parcel Id Number Tax Id: 14260204015
  • Tax Year: 2011

Multi Family

  • Total Number Units: 7

Ownership History

Date Name Owned For Owner Type

Purchase Details

Closed on
Oct 29, 2018
Sold by
Liang Si Min
Bought by
Si
Current Estimated Value
$94,160

Purchase Details

Listed on
Feb 2, 2012
Closed on
May 22, 2012
Seller's Agent
Joe Tetzlaff
RE/MAX Professionals
Buyer's Agent
Matthew Holcomb
IN BETWEEN OFFICES
List Price
$92,000
Sold Price
$55,000
Premium/Discount to List
-$37,000
-40.22%

Home Financials for this Owner

Home Financials are based on the most recent Mortgage that was taken out on this home.
Avg. Annual Appreciation
3.53%

Purchase Details

Closed on
Jul 1, 2009

Purchase Details

Closed on
Sep 17, 2008

Purchase Details

Closed on
Dec 4, 2007

Purchase Details

Closed on
Dec 18, 2001

Purchase Details

Closed on
Dec 31, 1998
Source: Public Records

Range of Values:

Collateral Analytics

Collateral Analytics Collateral Analytics AVMs (Automated Valuation Model) employ a number of statistical approaches combined with neighborhood-specific comparable selection guarantees the most up-to-date and precise valuations.

Not Available

Collateral Analytics does not have data for the current month. Please view the chart for historical values.

ICE

ICE Mortgage Technology ICE Mortgage Technology’s AVM (Automated Valuation Model) is a state-of-the-art online residential property valuation tool that provides a quick and accurate estimate of the value of almost any home in the U.S.

Not Available

ICE Mortgage Technology does not have data for the current month. Please view the chart for historical values.

First American

First American First American Data & Analytics’ next-generation AVM combines unrivaled data assets with a blended ensemble of valuation models to produce highly accurate, reliable valuations you can trust.

Not Available

First American does not have data for the current month. Please view the chart for historical values.

Quantarium

Quantarium Quantarium’s valuation service, repeatedly proven the industry’s most accurate and comprehensive, is supercharged with a self-learning and auto-tuning AI engine that continually becomes smarter and more accurate as it processes daily inputs from the industry’s leading RE data lake.

Not Available

Quantarium does not have data for the current month. Please view the chart for historical values.

Average Value
Not Available
List Price
Sold Price
Create a Home Valuation Report for This Property
The Home Valuation Report is an in-depth analysis detailing your home's value as well as a comparison with similar homes in the area

Home Values in the Area

Source: Public Records

Average Home Value in this Area


Source: Public Records

Purchase History

Date Buyer Sale Price Title Company
Si -- --
-- $55,000 --
-- $80,000 --
-- $58,000 --
-- -- --
-- $75,000 --
-- $75,000 --
Source: Public Records

Property History

Date Event Price Change Sq Ft Price
05/22/2012 05/22/12 Sold $55,000 -40.2% $12 / Sq Ft
05/08/2012 05/08/12 Pending -- -- --
02/02/2012 02/02/12 For Sale $92,000 -- $20 / Sq Ft
Source: RMLS Alliance

Tax History Compared to Growth

Source: Public Records

Tax History

Year Tax Paid Tax Assessment Tax Assessment Total Assessment is a certain percentage of the fair market value that is determined by local assessors to be the total taxable value of land and additions on the property. Land Improvement
2024 $2,282 $25,213 $4,968 $20,245
2023 $2,195 $22,842 $4,501 $18,341
2022 $2,115 $21,744 $4,285 $17,459
2021 $1,964 $19,939 $3,929 $16,010
2020 $1,907 $19,824 $3,906 $15,918
2019 $1,865 $19,749 $3,891 $15,858
2018 $1,838 $20,124 $3,965 $16,159
2017 $1,775 $19,511 $3,844 $15,667
2016 $1,683 $18,417 $3,628 $14,789
2015 $1,678 $18,332 $3,611 $14,721
2014 $2,255 $24,994 $3,728 $21,266
2013 $2,299 $26,398 $3,937 $22,461
Source: Public Records

Agents Affiliated with this Home

  • Section Image
See All Agents

Map

Source: RMLS Alliance

MLS Number: RMACA120451

RMLS Alliance

APN: 14-26.0-204-015