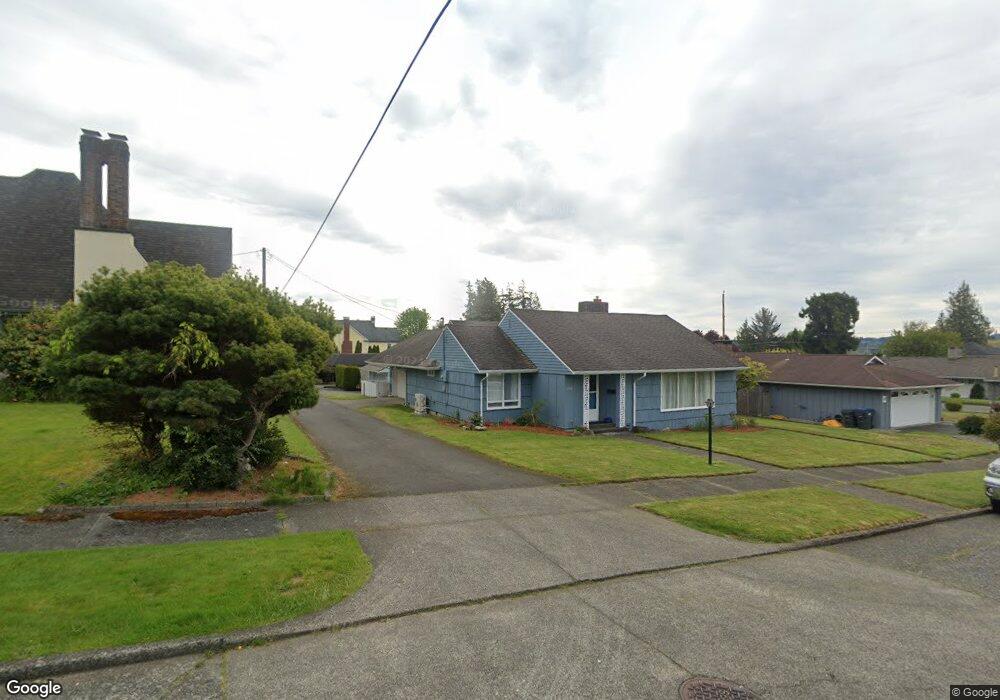
1110 N K St Aberdeen, WA 98520
Estimated Value: $292,000 - $312,039
3
Beds
2
Baths
1,378
Sq Ft
$218/Sq Ft
Est. Value
About This Home
This home is located at 1110 N K St, Aberdeen, WA 98520 and is currently estimated at $300,510, approximately $218 per square foot. 1110 N K St is a home located in Grays Harbor County with nearby schools including McDermoth Elementary School, Miller Junior High School, and J.M. Weatherwax High School.
Ownership History
Date
Name
Owned For
Owner Type
Purchase Details
Closed on
Apr 26, 2022
Sold by
Hb3 Alternative Holdings Llc
Bought by
Cascade Funding Mortgage Trust
Current Estimated Value
Home Financials for this Owner
Home Financials are based on the most recent Mortgage that was taken out on this home.
Original Mortgage
$247,000
Outstanding Balance
$234,348
Interest Rate
5.11%
Mortgage Type
New Conventional
Estimated Equity
$66,162
Purchase Details
Closed on
Oct 5, 2021
Sold by
Nationstar Reo Sub 1B Llc
Bought by
Hb3 Alternative Holdings Llc
Purchase Details
Closed on
Feb 7, 2020
Sold by
Esses Ludlow T and Esses Carol Ann
Bought by
Nationstar Reo Sub 1B Llc and Nationstar Mortgage Llc
Purchase Details
Closed on
Jan 19, 2010
Sold by
Esses Ludlow T
Bought by
Esses Ludlow T
Create a Home Valuation Report for This Property
The Home Valuation Report is an in-depth analysis detailing your home's value as well as a comparison with similar homes in the area
Home Values in the Area
Average Home Value in this Area
Purchase History
| Date | Buyer | Sale Price | Title Company |
|---|---|---|---|
| Cascade Funding Mortgage Trust | -- | Pacific Title | |
| Hb3 Alternative Holdings Llc | $171,551 | Pacific Title | |
| Nationstar Reo Sub 1B Llc | $195,000 | None Available | |
| Esses Ludlow T | -- | None Available |
Source: Public Records
Mortgage History
| Date | Status | Borrower | Loan Amount |
|---|---|---|---|
| Open | Cascade Funding Mortgage Trust | $247,000 |
Source: Public Records
Tax History Compared to Growth
Tax History
| Year | Tax Paid | Tax Assessment Tax Assessment Total Assessment is a certain percentage of the fair market value that is determined by local assessors to be the total taxable value of land and additions on the property. | Land | Improvement |
|---|---|---|---|---|
| 2025 | $2,469 | $257,771 | $46,640 | $211,131 |
| 2023 | $2,181 | $257,771 | $46,640 | $211,131 |
| 2022 | $2,465 | $211,473 | $43,200 | $168,273 |
| 2021 | $2,202 | $211,473 | $43,200 | $168,273 |
| 2020 | $2,140 | $171,551 | $40,000 | $131,551 |
| 2019 | $1,780 | $165,287 | $40,000 | $125,287 |
| 2018 | $2,089 | $144,682 | $40,000 | $104,682 |
| 2017 | $1,945 | $131,597 | $40,000 | $91,597 |
| 2016 | $1,723 | $127,235 | $40,000 | $87,235 |
| 2014 | -- | $119,240 | $40,000 | $79,240 |
| 2013 | -- | $127,615 | $40,000 | $87,615 |
Source: Public Records
Map
Nearby Homes