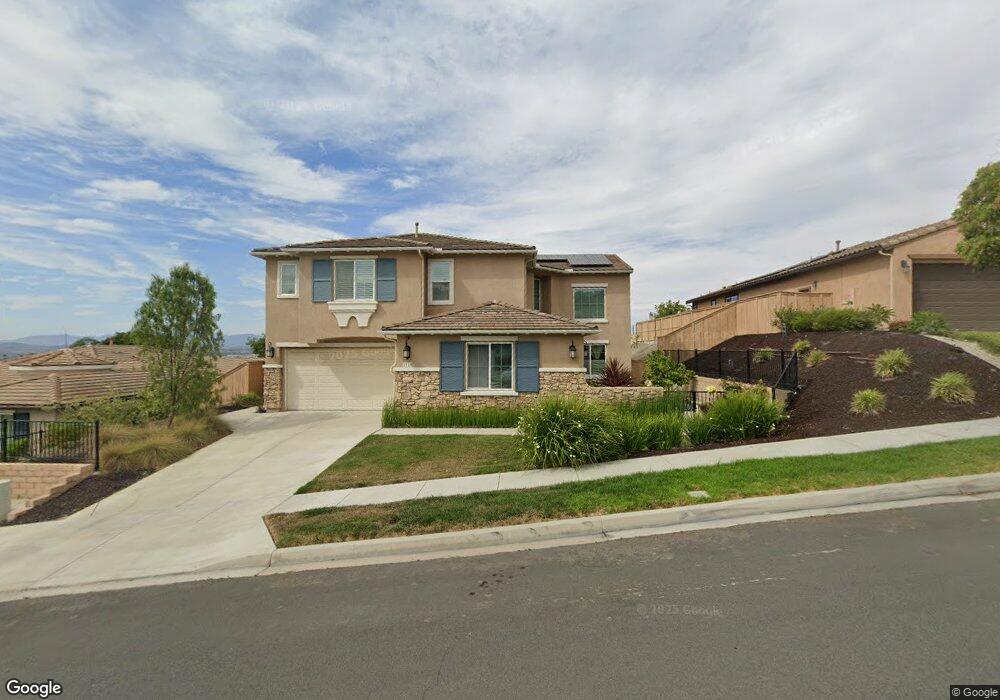
1110 Ocean Ridge Ct Oceanside, CA 92056
Guajome NeighborhoodEstimated Value: $1,218,825 - $1,301,000
5
Beds
4
Baths
3,341
Sq Ft
$378/Sq Ft
Est. Value
About This Home
This home is located at 1110 Ocean Ridge Ct, Oceanside, CA 92056 and is currently estimated at $1,262,456, approximately $377 per square foot. 1110 Ocean Ridge Ct is a home located in San Diego County with nearby schools including Empresa Elementary School, Roosevelt Middle School, and Vista High School.
Ownership History
Date
Name
Owned For
Owner Type
Purchase Details
Closed on
May 24, 2024
Sold by
Senvisky John Edward and Senvisky Antonina
Bought by
Senvisky Family Trust and Senvisky
Current Estimated Value
Purchase Details
Closed on
Nov 14, 2016
Sold by
Tran Hoang Kim and Tran Kimberly
Bought by
Senvisky John E and Antonina Senvisky I
Purchase Details
Closed on
Dec 27, 2012
Sold by
Zephyr Panorama Ridge Llc
Bought by
Tran Hoang Kim and Tran Kimberly
Purchase Details
Closed on
Jun 22, 2011
Sold by
Panorama Ridge Llc
Bought by
Zephyr Panorama Ridge Llc
Home Financials for this Owner
Home Financials are based on the most recent Mortgage that was taken out on this home.
Original Mortgage
$1,700,000
Interest Rate
4.56%
Mortgage Type
Purchase Money Mortgage
Create a Home Valuation Report for This Property
The Home Valuation Report is an in-depth analysis detailing your home's value as well as a comparison with similar homes in the area
Home Values in the Area
Average Home Value in this Area
Purchase History
| Date | Buyer | Sale Price | Title Company |
|---|---|---|---|
| Senvisky Family Trust | -- | None Listed On Document | |
| Senvisky John E | $715,000 | First American Title Company | |
| Tran Hoang Kim | $559,000 | First American Title Company | |
| Zephyr Panorama Ridge Llc | $2,727,332 | First American Title |
Source: Public Records
Mortgage History
| Date | Status | Borrower | Loan Amount |
|---|---|---|---|
| Previous Owner | Zephyr Panorama Ridge Llc | $1,700,000 |
Source: Public Records
Tax History
| Year | Tax Paid | Tax Assessment Tax Assessment Total Assessment is a certain percentage of the fair market value that is determined by local assessors to be the total taxable value of land and additions on the property. | Land | Improvement |
|---|---|---|---|---|
| 2025 | $6,246 | $588,773 | $168,876 | $419,897 |
| 2024 | $6,246 | $577,229 | $165,565 | $411,664 |
| 2023 | $6,094 | $565,912 | $162,319 | $403,593 |
| 2022 | $6,077 | $554,817 | $159,137 | $395,680 |
| 2021 | $5,940 | $543,939 | $156,017 | $387,922 |
| 2020 | $5,919 | $538,363 | $154,418 | $383,945 |
| 2019 | $5,831 | $527,808 | $151,391 | $376,417 |
| 2018 | $5,541 | $517,460 | $148,423 | $369,037 |
| 2017 | $70 | $507,314 | $145,513 | $361,801 |
| 2016 | $6,210 | $581,480 | $166,437 | $415,043 |
| 2015 | $6,184 | $572,746 | $163,937 | $408,809 |
| 2014 | $6,030 | $561,527 | $160,726 | $400,801 |
Source: Public Records
Map
Nearby Homes
- 1303 Darwin Dr
- 475 Taylor Dr
- 1376 Darwin Dr
- 5216 Palmera Dr
- 1400 Darwin Dr
- 1413 Eastview Ct
- 241 Richard Ct
- 5259 Hubbert St
- 1508 Laurelwood Way
- 5177 Loma Verde
- 4719 Mystik Rd
- 1513 Powell Rd
- 4699 Mystik Rd
- 1517 Leonis Place
- 1515 Fig Tree Way
- 1728 Valley Oak Way
- 1715 Crabapple Way
- 1700 Laurelwood Way
- 1549 Fig Tree Way
- 1513 Avila Ln
- 1114 Ocean Ridge Ct
- 1106 Ocean Ridge Ct
- 1118 Ocean Ridge Ct
- 1102 Ocean Ridge Ct
- 1113 Ocean Ridge Ct
- 1109 Ocean Ridge Ct
- 1124 Ocean Ridge Ct
- 1117 Ocean Ridge Ct
- 1128 Ocean Ridge Ct
- 1105 Ocean Ridge Ct
- 1121 Ocean Ridge Ct
- 1101 Ocean Ridge Ct
- 1232 Darwin Dr
- 1125 Ocean Ridge Ct
- 1132 Ocean Ridge Ct
- 1228 Darwin Dr
- 1239 Sunglow Dr
- 1235 Sunglow Dr
- 1224 Darwin Dr
- 1275 Darwin Dr
Your Personal Tour Guide
Ask me questions while you tour the home.