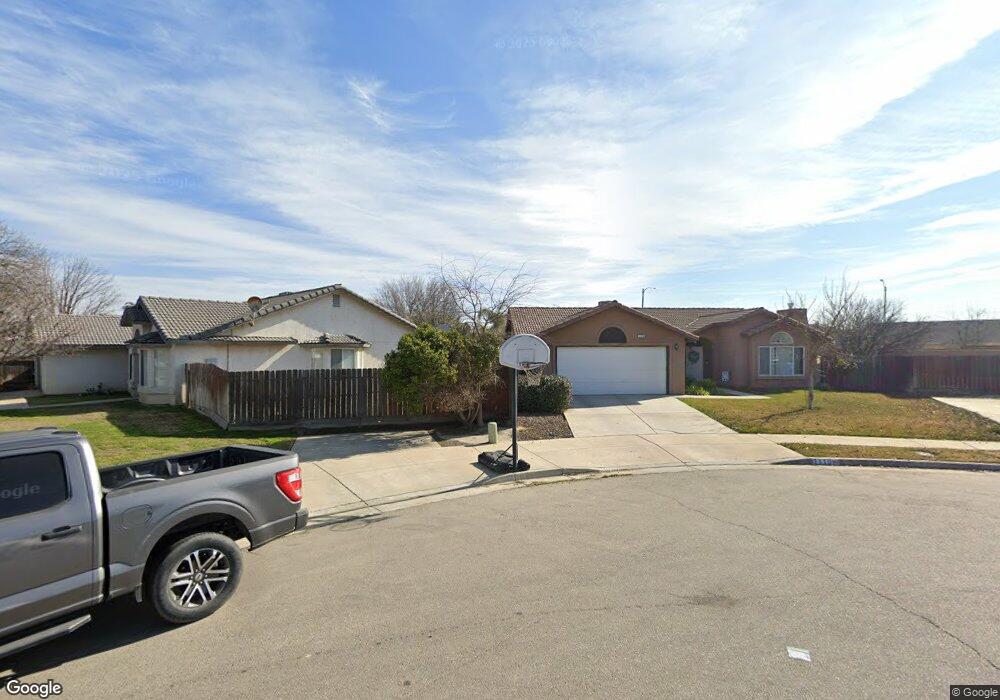
1110 Sequoia Ave Lemoore, CA 93245
Estimated Value: $384,000 - $399,402
4
Beds
2
Baths
1,686
Sq Ft
$233/Sq Ft
Est. Value
About This Home
This home is located at 1110 Sequoia Ave, Lemoore, CA 93245 and is currently estimated at $393,351, approximately $233 per square foot. 1110 Sequoia Ave is a home located in Kings County with nearby schools including Meadow Lane Elementary School, Liberty Middle School, and Lemoore High School.
Ownership History
Date
Name
Owned For
Owner Type
Purchase Details
Closed on
Mar 4, 2009
Sold by
Lemoore Redevelopment Agency
Bought by
Lopez Thomas K and Lopez Kleo M
Current Estimated Value
Home Financials for this Owner
Home Financials are based on the most recent Mortgage that was taken out on this home.
Original Mortgage
$167,633
Outstanding Balance
$106,705
Interest Rate
5.15%
Mortgage Type
FHA
Estimated Equity
$286,646
Purchase Details
Closed on
Aug 8, 2006
Sold by
Covington R Mitch and The Makenna Covington Irrevoca
Bought by
The Lemoore Redevelopment Agency
Home Financials for this Owner
Home Financials are based on the most recent Mortgage that was taken out on this home.
Original Mortgage
$32,500
Interest Rate
6.57%
Mortgage Type
Seller Take Back
Purchase Details
Closed on
Jul 5, 2006
Sold by
Valley Vanguard Properties Inc
Bought by
Covington R Mitch and The Makenna Covington Irrevoca
Home Financials for this Owner
Home Financials are based on the most recent Mortgage that was taken out on this home.
Original Mortgage
$32,500
Interest Rate
6.57%
Mortgage Type
Seller Take Back
Create a Home Valuation Report for This Property
The Home Valuation Report is an in-depth analysis detailing your home's value as well as a comparison with similar homes in the area
Home Values in the Area
Average Home Value in this Area
Purchase History
| Date | Buyer | Sale Price | Title Company |
|---|---|---|---|
| Lopez Thomas K | $220,000 | Chicago Title Company | |
| The Lemoore Redevelopment Agency | -- | Chicago Title Co | |
| Covington R Mitch | $33,500 | Chicago Title Co |
Source: Public Records
Mortgage History
| Date | Status | Borrower | Loan Amount |
|---|---|---|---|
| Open | Lopez Thomas K | $167,633 | |
| Previous Owner | Covington R Mitch | $32,500 |
Source: Public Records
Tax History
| Year | Tax Paid | Tax Assessment Tax Assessment Total Assessment is a certain percentage of the fair market value that is determined by local assessors to be the total taxable value of land and additions on the property. | Land | Improvement |
|---|---|---|---|---|
| 2025 | $3,024 | $283,306 | $83,703 | $199,603 |
| 2023 | $3,024 | $272,306 | $80,453 | $191,853 |
| 2022 | $3,166 | $266,968 | $78,876 | $188,092 |
| 2021 | $3,090 | $261,734 | $77,330 | $184,404 |
| 2020 | $3,074 | $259,050 | $76,537 | $182,513 |
| 2019 | $3,052 | $253,970 | $75,036 | $178,934 |
| 2018 | $2,876 | $248,990 | $73,565 | $175,425 |
| 2017 | $2,883 | $244,108 | $72,123 | $171,985 |
| 2016 | $2,720 | $239,322 | $70,709 | $168,613 |
| 2015 | $2,669 | $232,000 | $65,000 | $167,000 |
| 2014 | $2,230 | $193,374 | $55,250 | $138,124 |
Source: Public Records
Map
Nearby Homes
- 1358 Peachwood St
- 636 Castellina St
- 444 Avalon Dr
- 369 W Spring Ln
- 422 W Spring Ln
- 339 W Spring Ln
- 1023 Revere Way
- 272 W Burlwood Ln
- 687 Woodridge Ct
- 315 W Glendale Ave
- 217 W Hazelwood Dr
- 179 W Hazelwood Place
- 1490 Summerwind Dr
- 237 W Glendale Ave
- 137 W Spruce Ave
- 125 W Deodar Ln
- 342 G Aly Units X&y
- 334 G St Unit X
- 5 W Spring Ln
- 1459 Chimney Way
- 1013 Scotland St
- 1109 Sequoia Ave
- 1115 Paris Place
- 1109 Paris Place
- 1115 Sequoia Ave
- 998 Tranquility Ct
- 1014 Tranquility Ct
- 1121 Sequoia Ave
- 986 Tranquility Ct
- 992 Scotland St
- 1032 Scotland St
- 1012 Scotland St
- 1127 Sequoia Ave
- 972 Scotland St
- 974 Tranquility Ct
- 1110 Paris Place
- 1034 Tranquility Ct
- 962 Tranquility Ct
- 1133 Sequoia Ave
- 1139 Sequoia Ave