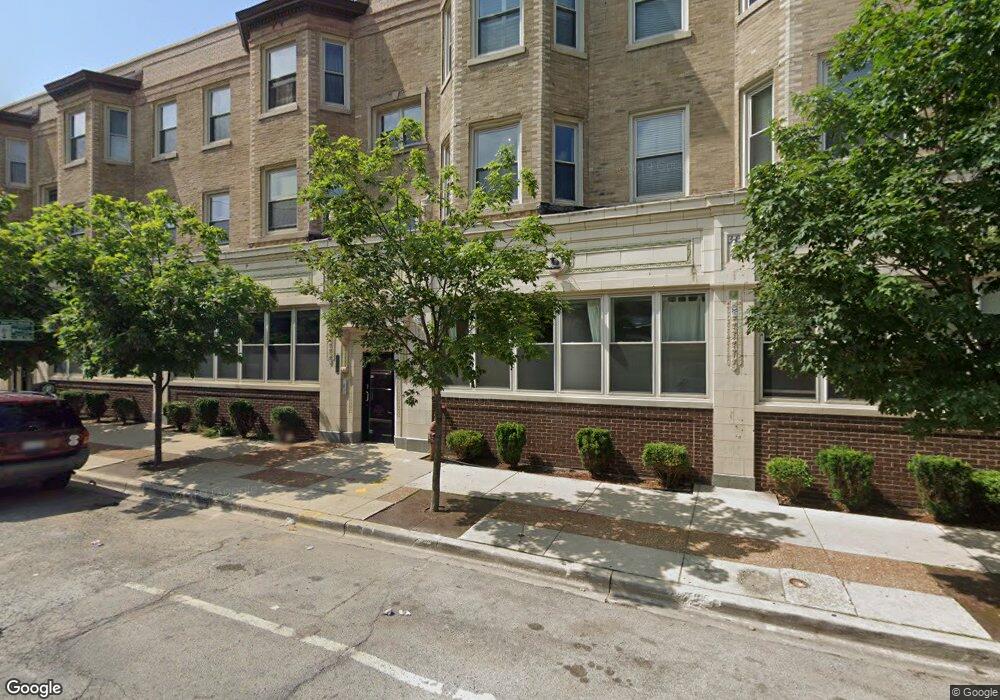
1110 W Leland Ave Unit 11101B Chicago, IL 60640
Sheridan Park NeighborhoodEstimated Value: $338,000 - $362,772
--
Bed
--
Bath
--
Sq Ft
0.39
Acres
About This Home
This home is located at 1110 W Leland Ave Unit 11101B, Chicago, IL 60640 and is currently estimated at $349,924. 1110 W Leland Ave Unit 11101B is a home located in Cook County with nearby schools including Brennemann Elementary School, Senn High School, and St Mary Of The Lake School.
Ownership History
Date
Name
Owned For
Owner Type
Purchase Details
Closed on
Jun 4, 2012
Sold by
Jpmorgan Chase Bank Na
Bought by
Orlando Elizabeth C
Current Estimated Value
Purchase Details
Closed on
Apr 30, 2012
Sold by
Federal National Mortgage Association
Bought by
Jp Morgan Chase Bank Na
Purchase Details
Closed on
Jul 19, 2010
Sold by
Milanova
Bought by
Federal National Mortgage Association
Purchase Details
Closed on
Mar 19, 2008
Sold by
New Leland Development Llc
Bought by
Milanova Rumyana E
Home Financials for this Owner
Home Financials are based on the most recent Mortgage that was taken out on this home.
Original Mortgage
$320,000
Interest Rate
6.25%
Mortgage Type
Purchase Money Mortgage
Create a Home Valuation Report for This Property
The Home Valuation Report is an in-depth analysis detailing your home's value as well as a comparison with similar homes in the area
Home Values in the Area
Average Home Value in this Area
Purchase History
| Date | Buyer | Sale Price | Title Company |
|---|---|---|---|
| Orlando Elizabeth C | $85,000 | None Available | |
| Jp Morgan Chase Bank Na | -- | None Available | |
| Federal National Mortgage Association | -- | None Available | |
| Milanova Rumyana E | $357,000 | Ticor Title Insurance | |
| Milanova Rumyana E | $357,000 | Ticor Title Insurance |
Source: Public Records
Mortgage History
| Date | Status | Borrower | Loan Amount |
|---|---|---|---|
| Previous Owner | Milanova Rumyana E | $320,000 |
Source: Public Records
Tax History Compared to Growth
Tax History
| Year | Tax Paid | Tax Assessment Tax Assessment Total Assessment is a certain percentage of the fair market value that is determined by local assessors to be the total taxable value of land and additions on the property. | Land | Improvement |
|---|---|---|---|---|
| 2024 | $4,083 | $27,572 | $4,937 | $22,635 |
| 2023 | $3,957 | $22,000 | $3,976 | $18,024 |
| 2022 | $3,957 | $22,000 | $3,976 | $18,024 |
| 2021 | $3,893 | $21,999 | $3,975 | $18,024 |
| 2020 | $3,547 | $18,473 | $3,048 | $15,425 |
| 2019 | $3,565 | $20,556 | $3,048 | $17,508 |
| 2018 | $3,503 | $20,556 | $3,048 | $17,508 |
| 2017 | $3,309 | $18,234 | $2,650 | $15,584 |
| 2016 | $3,321 | $18,563 | $2,650 | $15,913 |
| 2015 | $3,851 | $20,318 | $2,650 | $17,668 |
| 2014 | $2,492 | $13,032 | $2,020 | $11,012 |
| 2013 | $2,228 | $11,815 | $2,020 | $9,795 |
Source: Public Records
Map
Nearby Homes
- 4715 N Racine Ave Unit 305
- 4634 N Racine Ave Unit 3
- 1000 W Leland Ave Unit 12G
- 4603 N Racine Ave Unit 403
- 4641 N Magnolia Ave Unit 3S
- 4826 N Winthrop Ave Unit 2S
- 4832 N Winthrop Ave
- 4652 N Magnolia Ave
- 4642 N Magnolia Ave
- 4834 N Kenmore Ave Unit 3N
- 1215 W Gunnison St Unit 205
- 4616 N Magnolia Ave Unit 1
- 4616 N Magnolia Ave Unit 3
- 4612 N Magnolia Ave
- 4731 N Malden St Unit 3S
- 4755 N Malden St Unit GS
- 4879 N Winthrop Ave Unit D
- 905 W Lakeside Place Unit 2F
- 4848 N Sheridan Rd Unit 710
- 4606 N Malden St Unit GS
- 1110 W Leland Ave Unit 2A
- 1110 W Leland Ave Unit 2B
- 1114 W Leland Ave Unit 11143B
- 1114 W Leland Ave Unit 11142B
- 1114 W Leland Ave Unit 11143A
- 1114 W Leland Ave Unit 11142A
- 1114 W Leland Ave Unit 11141A
- 1110 W Leland Ave Unit 11103B
- 1110 W Leland Ave Unit 11102B
- 1110 W Leland Ave Unit 11103A
- 1110 W Leland Ave Unit 11102A
- 1110 W Leland Ave Unit 11101A
- 1114 W Leland Ave Unit 2A
- 1110 W Leland Ave Unit 3A
- 1114 W Leland Ave Unit 2B
- 1110 W Leland Ave Unit 1B
- 1110 W Leland Ave Unit 1A
- 1110 W Leland Ave Unit 1
- 1114 W Leland Ave Unit 3A
- 1110 W Leland Ave Unit 3B